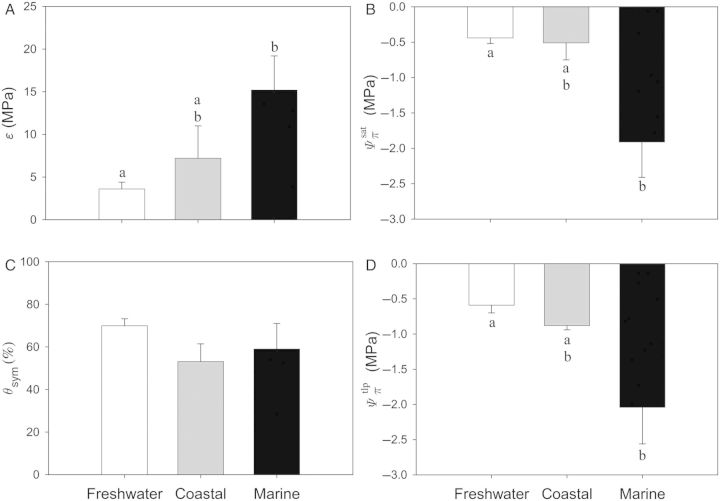
Figure 4.
Bulk elastic moduli (ɛ; A), solute potentials at full saturation ( ; B), symplastic water content (θsym; C) and solute potential at turgor loss point (
 ; D) for plants categorized as freshwater (white bars), coastal (grey bars) and marine (black bars). Statistical differences are indicated by the letters above the bars, wherein different letters identify significant differences among the three habitat types. Data are presented as means (grand means for each category as described in the Methods section) ± 1 SE.

