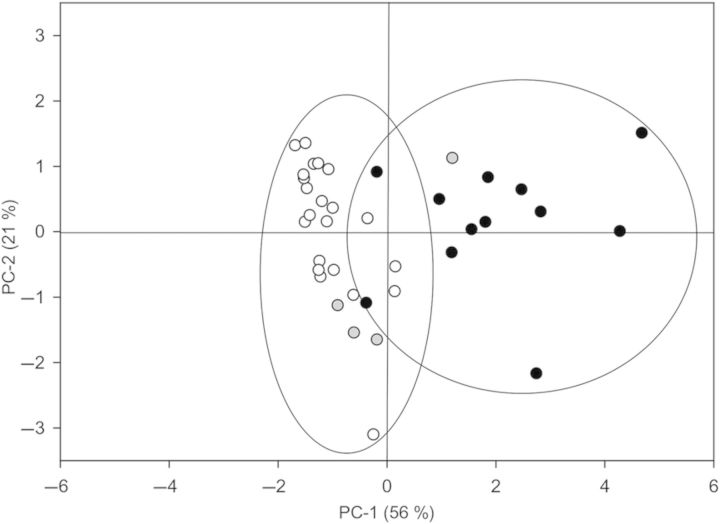
Figure 7.
Principal components analysis of physiological traits (ɛ, θsym,  and
and  ) measured in different aquatic and wetland plant species including freshwater (white circles), coastal (grey circles) and marine (black circles). Percentages of explained variances for the first and second principal components (PC) are in parentheses. Note the pronounced horizontal tendencies between freshwater and marine species.

