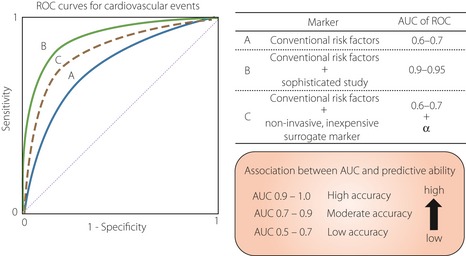
Figure 2.

Previous studies reported that a conventional risk assessment approach showed limited performance (blue solid line). In contrast, sophisticated studies, such as exercise electrocardiogram, myocardial perfusion scintigraphy, computed tomography, magnetic resonance imaging and coronary angiography, can determine disease severity with a high degree of sensitivity and specificity (green solid line). However, it is unrealistic to screen for cardiovascular disease (CVD) with these tools in all diabetic patients, as these tests are limited by the potential of significant adverse effects, technical difficulty, availability and high cost. Therefore, a non‐invasive and inexpensive risk prediction tool with more than moderate predictive ability (dot line) is required for identifying individuals at high‐risk of CVD. AUC, area under curve; ROC, receiver operator characteristic.
