
Figure 1.
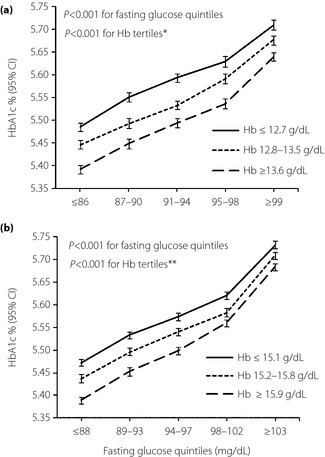
Glucose‐stratified comparison of hemoglobin A1c (HbA1c) between hemoglobin tertiles in (a) women (b) men. Adjusted for age. *,**P < 0.001 (Tukey's post‐hoc analysis of two way anova) between all three different combinations of hemoglobin (Hb) groups in women and men, respectively. CI, confidence interval.