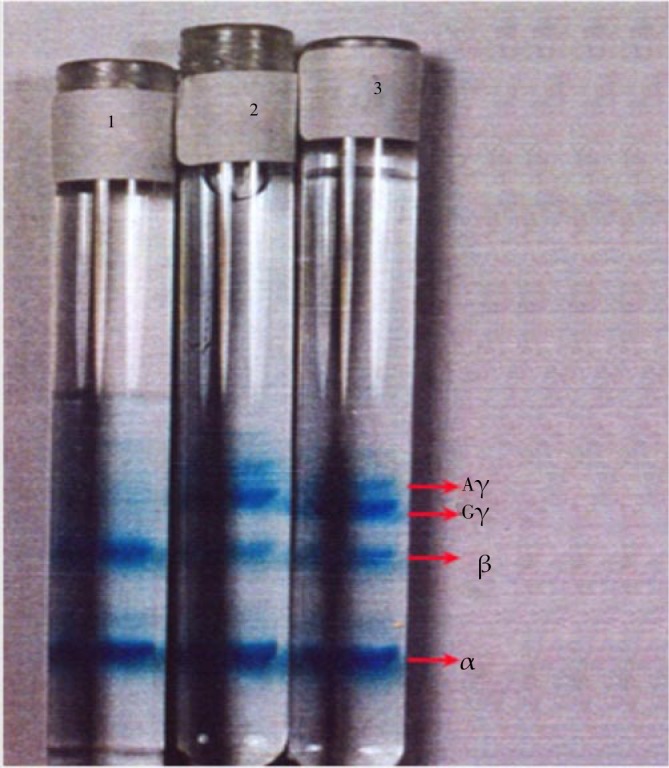
Figure 3. Tubes with poly acrylamide gels after staining and destaining.

The increment of γ chains after 2.5 and 5 months is so clear. From the top to the bottom, bands correspond to carbonic anhydrase and globin chains Aγ, Gγ, β and α respectively.

The increment of γ chains after 2.5 and 5 months is so clear. From the top to the bottom, bands correspond to carbonic anhydrase and globin chains Aγ, Gγ, β and α respectively.