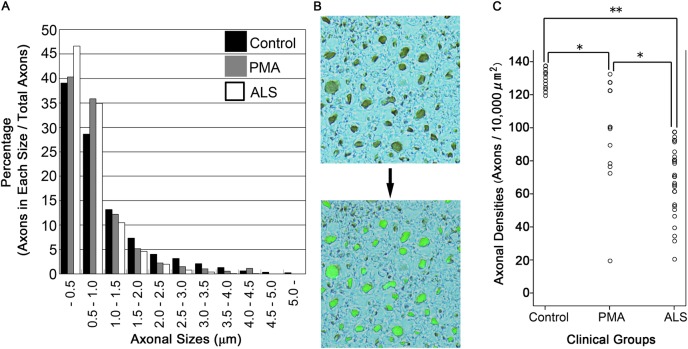
Figure 2.
Quantitative analysis of the axonal fibres in the corticospinal tract. (A) Phosphorylated neurofilament (pNF)-positive fibres were automatically binarised using Luzex AP software. The density of pNF-positive axons (particles/10 000 μm2) was automatically calculated using averaged data from five fields (×400). The histogram of axonal sizes revealed that the percentages of axons that were more than 1 μm in diameter were smaller in ALS and PMA than in controls. (B) The large axonal fibres more than 1 μm in diameter were automatically recognised, binarised and counted using the software to successfully evaluate the axonal density. (C) There were significant differences in the densities of axons that were more than 1 μm in diameter between all pairs of clinical groups: p=0.001 (*) between the clinical amyotrophic lateral sclerosis (ALS) and clinical progressive muscular atrophy (PMA) groups, p=0.001 (*) between the clinical PMA and control groups and p<0.001 (**) between the clinical ALS and control groups. All patients diagnosed with clinical ALS exhibited lower values than the controls. In contrast, the results of the clinical PMA group were widely diverse, ranging from low values to values within the normal range.

