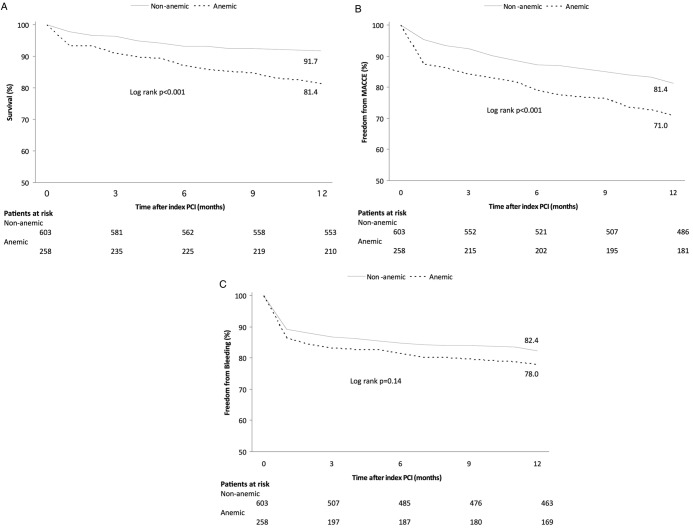
Figure 1.
Kaplan-Meier survival curves for the occurrence of adverse events in anaemic (dotted lines) versus non-anaemic (solid line) patients at 2-month follow-up: all-cause mortality (A), MACCE free survival (B) and bleeding event-free survival (C). MACCE, major adverse cardiac and cerebrovascular events; PCI, percutaneous coronary intervention.

