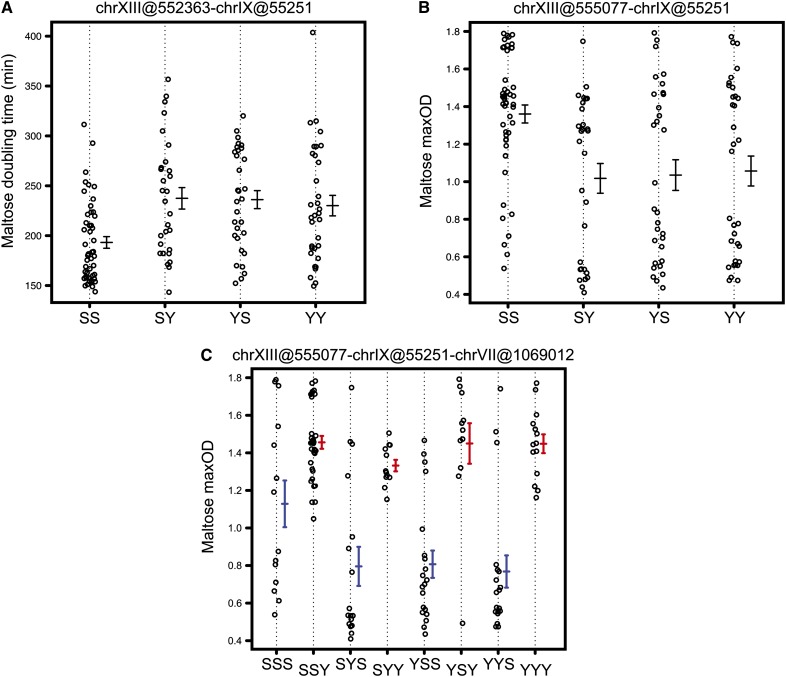
Figure 3.
Scatter plots for growth parameters in sucrose showing two-QTL and three-QTL interactions. (A, B) Two-QTL scatter plots for chrV(371,899) and chrXV(473,018) for doubling time and maxOD, respectively. The QTL are indicated as chromosome number followed by marker position in bp within brackets. The x-axis indicates biallelic marker genotype in the QTL order written above the plots. (C) A three-QTL scatter plot for chrV(525,070), chrXV(473,018), and chrV(371,899) for maxOD. The QTL are indicated as chromosome number followed by marker position in bp within brackets. The x-axis indicates triallelic marker genotype in the QTL order written above the plot. The color of error bars (± 1 SE) indicates allele of chrV(525,070) marker with S allele (blue) and Y allele (red).

