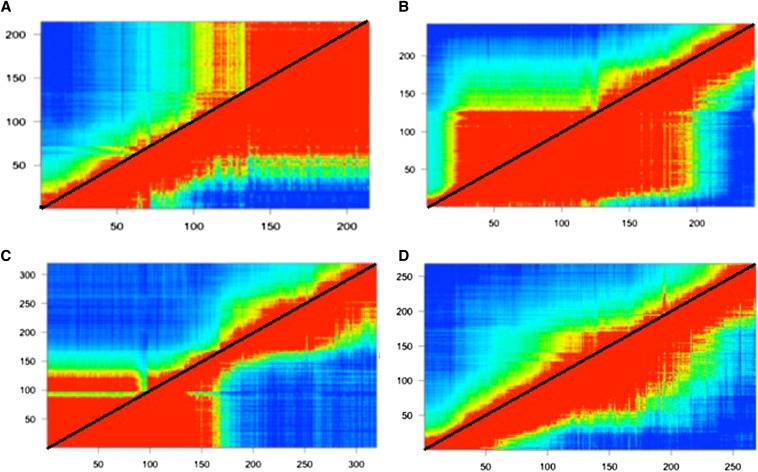
Figure 2.
Heat map of the estimated recombination fraction between markers (below diagonal) and the corresponding LOD scores (above diagonal). The LOD score is for a test of the null hypothesis that the true recombination fraction between markers is 0.5 (free recombination). Low estimates of recombination fraction and corresponding high LOD scores are shaded red while blue represents the converse. (A) Chromosome 5, (B) Chromosome 10, (C) Chromosome 8, and (D) Chromosome 4. Putative inversions are apparent in (A), (B), and (C). (D) illustrates a chromosome lacking recombination suppression.

