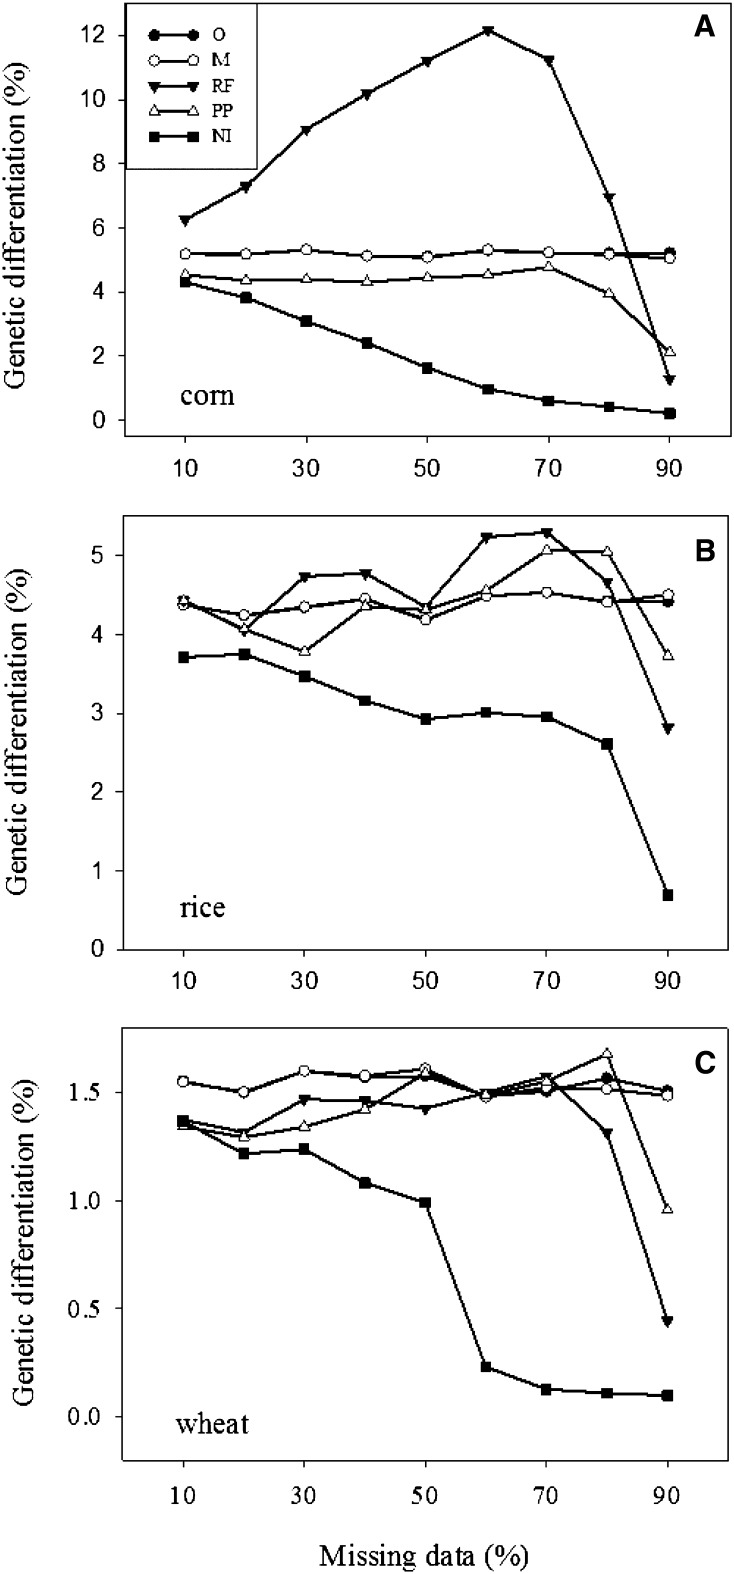
Figure 3.
Estimates of genetic differentiations (or Φst statistic) among four groups of 130 individual lines randomly sampled from each SNP genotype data set (A: corn, B: rice, and C: wheat) over 100 runs of simulation with 10–90% of total observations as random missing (M, missing data without imputation) and as imputed with an imputation method (RF, random forest; PP, probabilistic principal component analysis [PCA]; or NI, nonlinear iterative partial least squares PCA). Note that the genetic differentiations also were estimated based on the original SNP data (=O for short) for the corresponding 130 individual lines selected for each simulation run.

