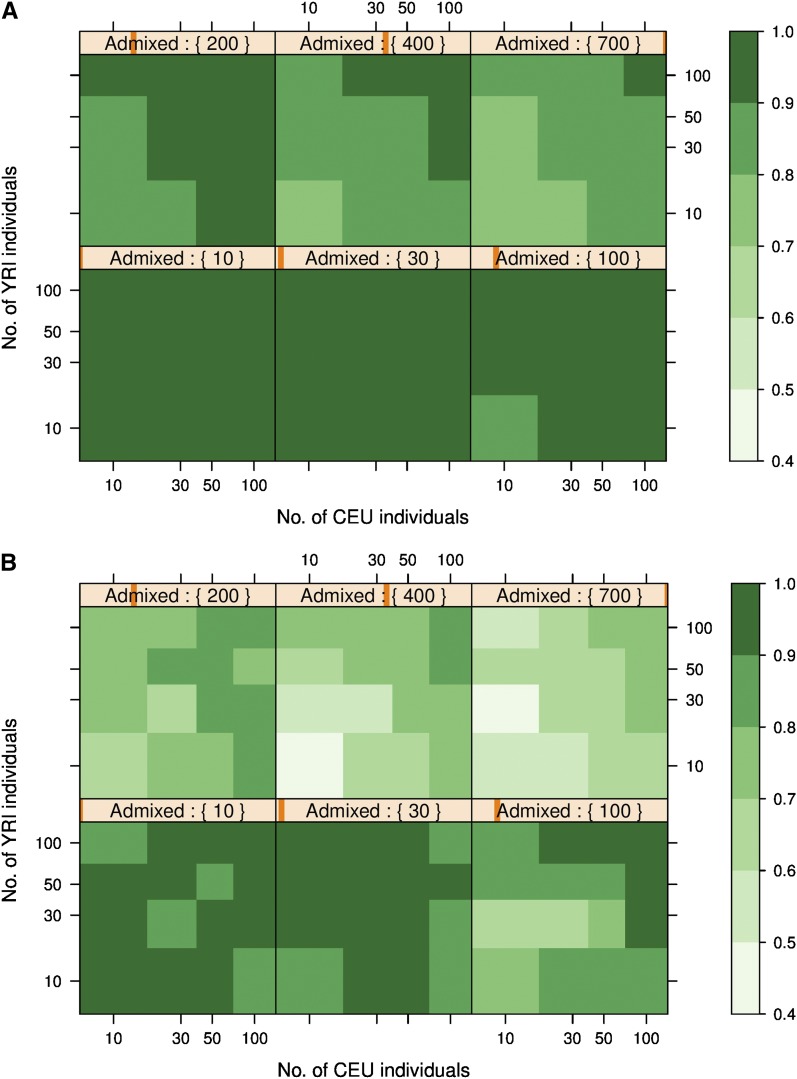
Figure 2.
Squared correlation between the true individual ancestry and the individual ancestry inferred using (A) ADMIXTURE with K = 2 and (B) EIGENSOFT with the top eigenvalue. The different levelplots are drawn for different number of admixed individuals in the dataset. The X and Y axes of the plots are logarithmic in scale.

