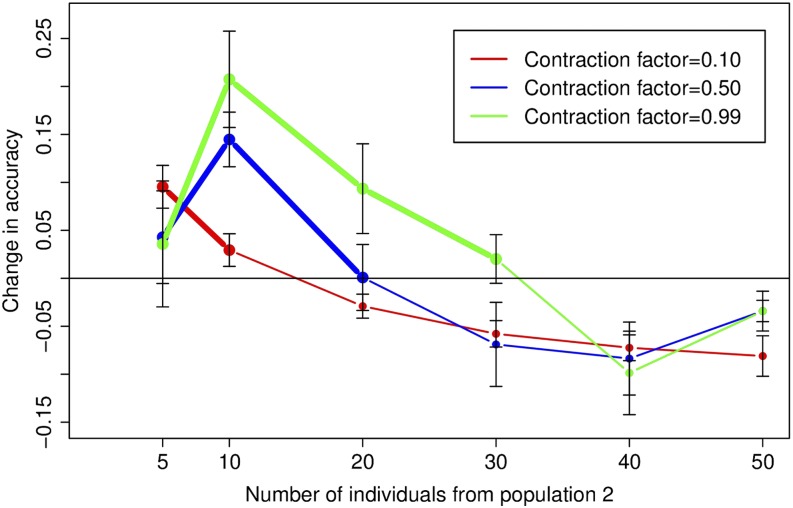
Figure 7.
Change in correlation measure from Figure 6 after the resampling correction, taking into account the impact of the contraction on effective population size. Each curve is drawn for a single value of the contraction factor α and shows the mean and standard error of the change in correlation measure over 30 datasets. The regions of the curves in bold show regions where accuracy in the uncorrected results (from Figure 6) is less than 0.95.

