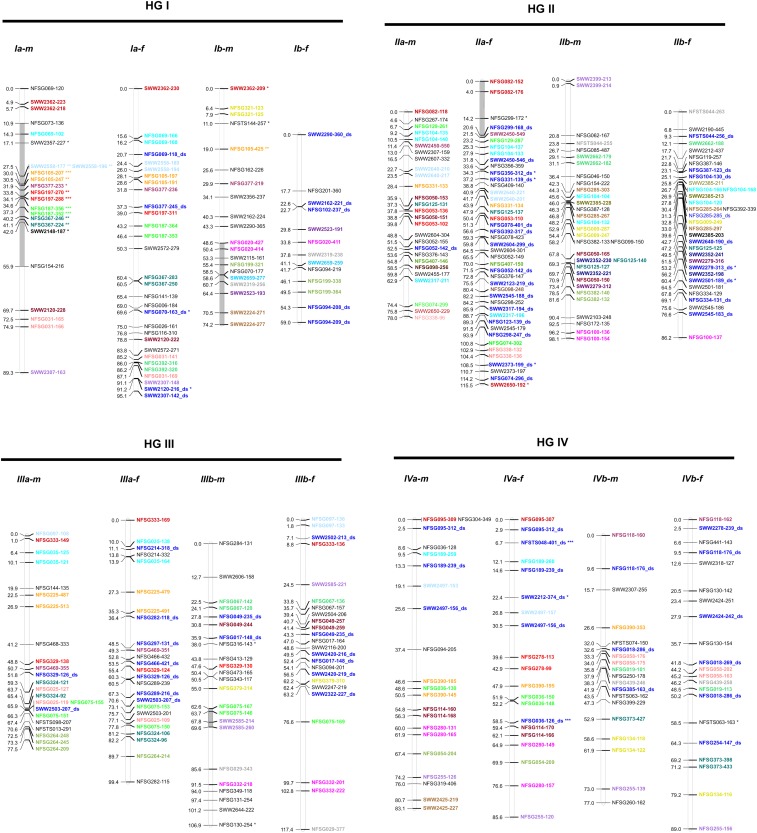
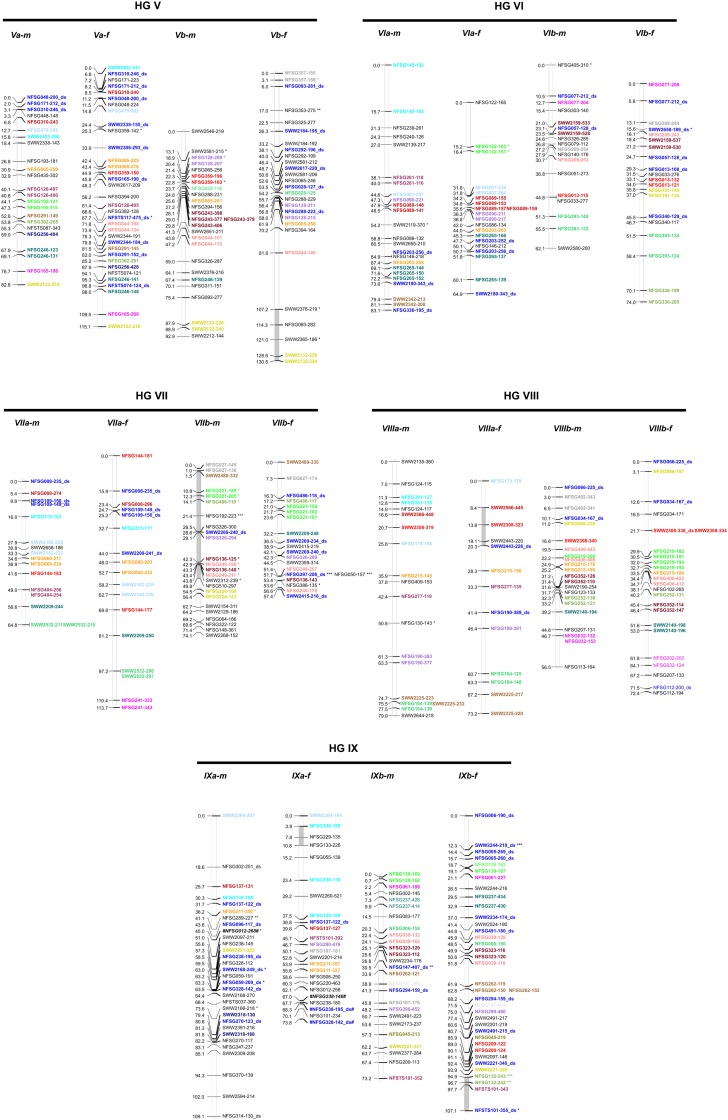
Figure 2.
Consensus linkage map of PV281 and NF472. PV281 linkage groups were constructed by integrating genotypic data from both self-fertilized individuals (n = 74) and PV281 × NF472 hybrid individuals (n = 108) (see Materials and Methods). The Roman numeral designation of each homology group (I–IX) follows the foxtail millet chromosomes. NF472 linkage groups were constructed based only on hybrid individuals as it served as the male donor in the cross. Individual linkage groups are indicated by vertical bars. Numbers to the left of the bar indicate position in cM, whereas marker names are indicated to the right of the bar. Markers ending in “ds” are double simplex markers present in both parents. Markers used to align the subgenomes were amplicons of different fragment length detected with the same primer set. These markers are set-off by similar color labeling. The letters (f) and (m) at the end of the linkage group name denote female (PV281) and male (NF472) parental maps, respectively. Severely distorted markers are noted with asterisks: *P = 0.01, **P = 0.001, and ***P = 0.0001. Shaded regions of the individual linkage groups indicate the presence of three or more consecutive markers with TRD. Markers with significant interactions on different linkage groups are indicated by a hash symbol (#).


