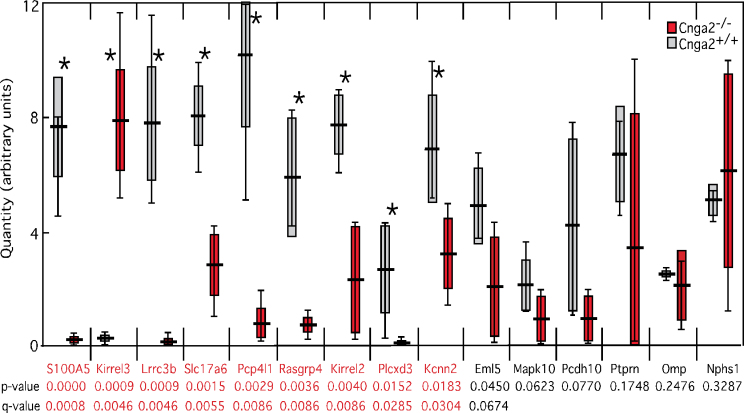
Figure 4.
Plots of qRT–PCR data comparing olfactory epithelium samples of Cnga2 −/− and Cnga2 +/+ female mice. Horizontal line: mean value; solid rectangle: 1 standard deviation; vertical bars: range of data; (*): significant difference. This figure is reproduced in color in the online version of the issue.

