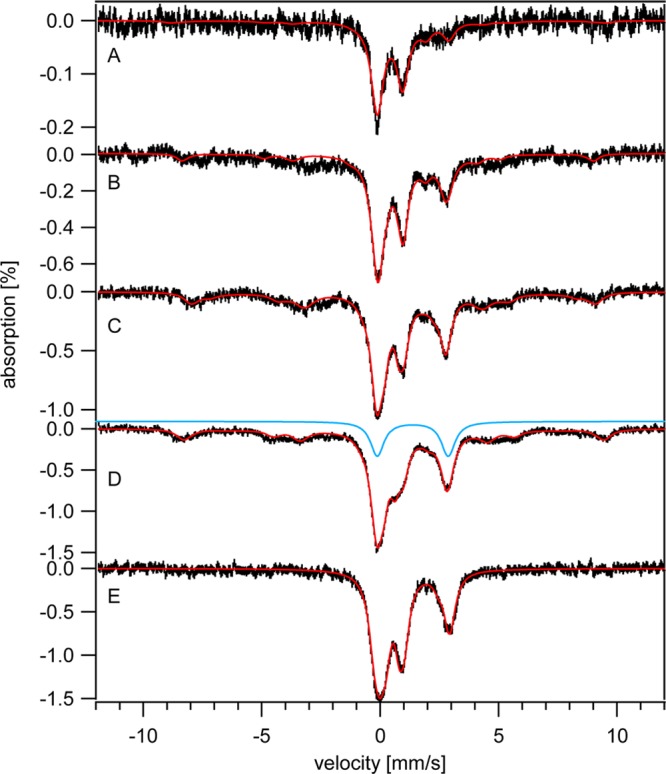
Figure 4.

Five K, 0.05 T Mössbauer spectra of Δccc1 cells and isolated mitochondria. A, Δ1 cells; B, Δ10 cells; C, Δ20 cells; D, Δ40 cells; E, mitochondria isolated from Δ40 cells. Red lines are simulations of the entire spectrum using the percentages given in Table 1. The blue line is a simulation of the NHHS FeII feature generated with parameters specified in Figure 1.
