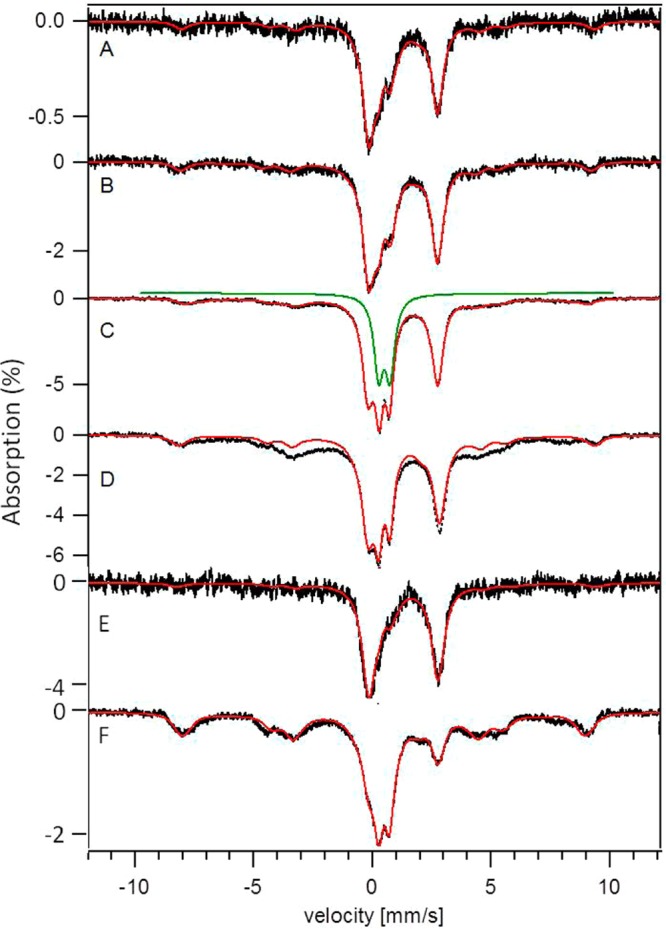
Figure 5.

Five K, 0.05 T Mössbauer spectra of CCC1-up cells grown at various FC concentrations. A, UP1; B, UP10; C, UP20; D, UP40; E, UP1+A; F, UP40+A. The red lines are simulations of the entire spectrum using the percentages in Table 1. The green line is a simulation of the nanoparticle feature generated using parameters specified in Figure 1.
