Abstract
The health care field is focusing considerable attention on dietary control, which requires that individuals record what they eat. We have developed a novel smartphone application called FoodLog, a multimedia food recording tool that allows users to take photos of their meals and to produce textual food records. Unlike conventional smartphone-based food recording tools, FoodLog allows users to employ meal photos to help them to input textual descriptions based on image retrieval. In this study, we conducted usability experiments to evaluate the routine daily use of FoodLog systems with and without image-based assistance. We produced 2 food recording tools: FoodLog with image-based assistance (FL-I) and FoodLog with text input only (FL-T). We recruited 18 university students (age = 18-24 years), all of whom performed food recording for the first time. The participants used FoodLog on a daily basis for 1 month. In the subjective evaluation, FL-I had higher average scores for questions related to ease of use, fun, frequency of browsing, and intention to continue. In particular, the latter 3 factors received significantly higher scores with FL-I than with FL-T. In the quantitative evaluation, the daily average number of meal events and food records did not differ significantly between FL-I and FL-T. A detailed analysis of the individual records showed that 1 participant produced 3 times as many records using FL-I compared with FL-T. The subjective assessment showed that our new tool, which fully exploits the use of images, is a promising method for food recording.
Keywords: food record, image retrieval, real-life experiment, smartphone, usability
Obesity is a growing global concern. Thus, dietary control is receiving considerable attention in the health care field. It is considered that recording our food intake is vital for controlling eating and health management. The traditional methods used for food recording rely on human memory, where subjects complete forms or answer questions in an interview to remember what they consumed. Manually recording detailed information about all meals is a tedious task, and it is difficult for people to adhere to this process over a long period. Thus, there is a strong demand for food intake recording using information technology.1
The rapid spread of mobile devices such as smartphones, which individuals may use to record personal information, means that they could be used as a data collection platform.2,3 A previous study showed that adolescents prefer dietary assessments using technology, such as PDAs, rather than traditional paper-based food recording.4 At present, quite a few smartphone apps are available for dietary self-management.5,6 However, the recording of food items is normally text based in current food recording tools. From a usability perspective, the burden of text-based data input is too high to promote continuous use. Thus, automatic or semiautomatic tools are being investigated.7-10 To the best of our knowledge, however, none of these tools has been made publicly available.
To assist food recoding, we developed a new smartphone-based application called FoodLog. Our system allows a user to take a photo of a meal and to interact with the photo on the smartphone screen, so they can input the names of food items with the assistance of image retrieval. Thus, food records can be viewed as a photographic food diary. (At present, our system is publicly available in Japan.) Compared with existing smartphone-based food recording applications, our system is very different because it fully exploits food pictures. In this study, we performed a comparative analysis of the usability of this new smartphone-based application for food recording.
Methods
Recruitment and Study Design
A sample of healthy university students aged 18 to 24 years was recruited from various schools at the University of Tokyo (11 males, 7 females) after we requested participants. Eighteen students applied to participate in the experiments, and no selection procedures were applied. The majority of the participants came from the School of Liberal Arts and Science. All of the participants were smartphone users. None of the participants had used FoodLog before and they had no experiences of food recording. On the first day, the participants came to our laboratory and either FoodLog with image-based assistance (FL-I) or FoodLog with text-based input only (FL-T) (the “apps”) was installed on their personal smartphones according to our instructions. They used the apps in their daily life. After approximately 2 weeks, the participants returned to the laboratory and they removed their app, before installing the other app, which they used for approximately 2 more weeks. Half of the participants started with FL-I and the other half started with FL-T. At the end of the trials, the participants returned to our laboratory and completed questionnaires. The food intake records and photos were uploaded automatically to a server, and a statistical analysis of the food records was conducted. The participants received no reminders or other interventions during the experiments. The study methods were approved by the University of Tokyo Institutional Review Board, and informed consent was obtained from each participant.
FoodLog: How It Works
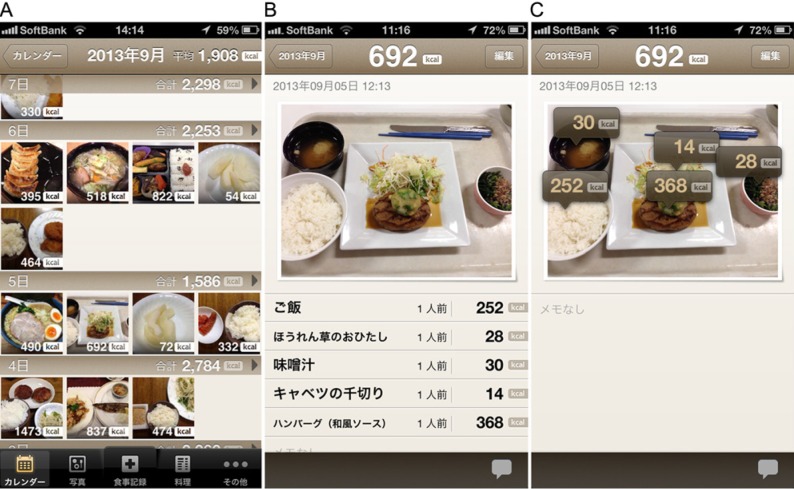
FoodLog uses photos of meals in 2 ways: as a visual food diary and to help the user to input the names of food items. Figure 1 shows examples of FoodLog screenshots. The calendar view shows that the visual food diary is easy to understand. Descriptions of food items in each image are shown in Figure 1B. In addition, Figure 1C demonstrates that the calorific contents of each food item are shown.
Figure 1.
Screenshots from FoodLog. Left to right: (A) calendar view; (B) view of a single day, where the food images are shown with descriptions of the food names, the portion sizes, and their calorific contents; and (C) a food image with labels showing the calorific contents of food items. (The food names are shown in Japanese.)
FoodLog has 2 modes for inputting the names of food items: a text-based mode and an image-assisted mode. Both modes are shown in Figure 2, where the text-based mode is shown below the dashed line and the image-assisted mode is above that line. Figure 2 shows that the text-based mode is the baseline method, while the image-assisted mode helps via image retrieval.
Figure 2.

Flowchart of food recording with FoodLog.
The text-based mode is almost the same as existing tools. In the text-based mode, the food name and portion size are required inputs. Part of the name is sufficient as an input because partial match searching is enabled. A standard database is searched when part of the name of the dish is entered as text. A personal database based on the user’s history is also searched simultaneously. Both of the search results are displayed as a list. The user can select from the list and select the portion size. Free text input is also available if no items are found in the databases.
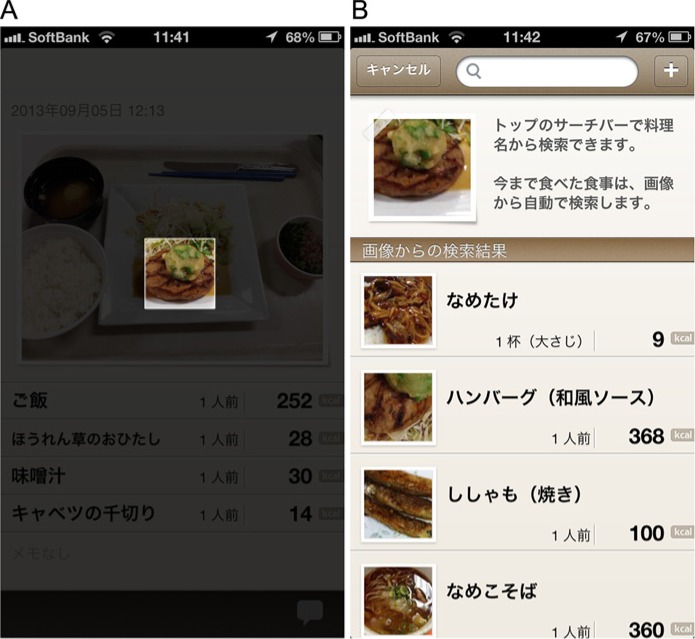
We developed the image-assisted mode to make these interactions simpler and more intuitive using an image retrieval technique. The system is operated as follows. (1) Take a photo of a meal. (2) Specify the food domain by touching the screen and adjust the size of the domain (Figure 3A). A visual similarity search in the personal image database is performed by the smartphone, and the top 20 results are shown as a list (Figure 3B). (3) Choose the appropriate food from the list and adjust its portion size. The specified food domain is then registered in the personal image database for the next search. The visual search process was sufficiently fast because the time required to search was much less than 1 second.
Figure 3.
Left to right: (A) the specified food domain; (B) results of the visual search. As shown in A, the food domain is specified by touching the screen, where the area outside the specified domain is darkened. In this example, the target is in the second rank of the list shown in B.
Provided that the food can be identified in the candidate list, the user operations are simply touch, adjust, and select. However, if the target food is completely new or the visual search results do not contain the appropriate food, the user employs the text-based mode to specify the food domain.
Experimental Comparison of Usability
FoodLog is a unique system that fully exploits food photos, and it also has a text-based input mode. As shown in Figure 2, the text-based mode, which has almost the same functionality as conventional tools, is overlaid with the image-assisted mode. Without the image-assisted mode, FoodLog is simply a text-based food recording tool. We produced 2 tools to investigate the usability of our system: FL-I and FL-T.
Data Used in the Evaluations
We performed quantitative and subjective usability evaluations. In the quantitative evaluation, we compared the number of food items and meal events recorded using the 2 tools. The food records made by the subjects were uploaded to our server automatically. We investigated whether there was a difference in the amount of FL-I and FL-T usage either on the average of all the subjects or individually.
The subjective evaluation was based on a questionnaire, which contained the following questions: (1) “How easy was it to make food records?” (2) “How much fun did you have making food records?” (3) “How often did you browse your food records?” and (4) “Do you want to continue food recording?” The subjects answered each question using a 5-point scale: positive = 5, weakly positive = 4, neutral = 3, weakly negative = 2, and negative = 1.
The 18 students who participated in these experiments had no previous experiences of food recording or the FoodLog system. During the approximately 1-month experiments, we did not send any reminders to encourage food recording. At the end of the trial, 6 of the participants had insufficient records, that is, the average number of food item records or images was less than 1.5 per day. We excluded these 6 participants from the statistical analysis.
Results
Subjective Evaluation
The results of the subjective evaluations of FL-I and FL-T are shown in Figure 4. The sample size was small, but the average evaluations for FL-I were better than those for FL-T. The responses to the following question categories differed significantly: A2, the amount of fun; A3, frequency of browsing; and A4, intention to continue use. For question A2, all of the subjects gave scores of 4 or 5 to FL-I, and the difference between FL-I and FL-T was particularly noticeable. Although the difference was not statistically significant, FL-I had a better average response than FL-T for question A1, that is, ease of use. The differences in the response scores given by individuals, that is, the score for FL-I minus that for FL-T, are shown in Figure 5.
Figure 4.
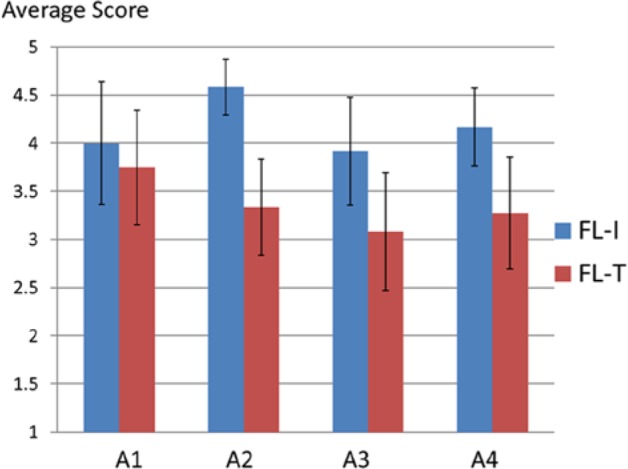
Subjective evaluation results, showing the average scores for ease of use (A1), fun (A2), frequency of browsing (A3), and intention to continue use (A4). The error bars represent the 95% confidence intervals.
Figure 5.
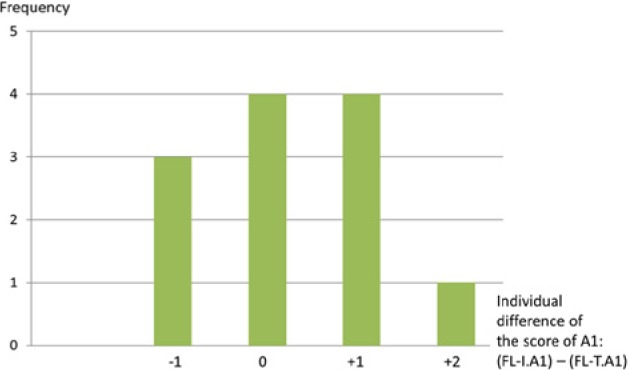
Histogram showing the individual differences in the scores for question A1, that is, the score for FL-I minus that for FL-T. The positive scores indicate that FL-I received better evaluations than FL-T.
Quantitative Evaluation
The results of the quantitative evaluation are shown in Figure 6. The average number of meals recorded per day was 2.7 with both FL-I and FL-T. The average numbers of food records were 6.8 and 6.3 for FL-I and FL-T, respectively. The number of images taken per day was 3.0 with FL-I.
Figure 6.
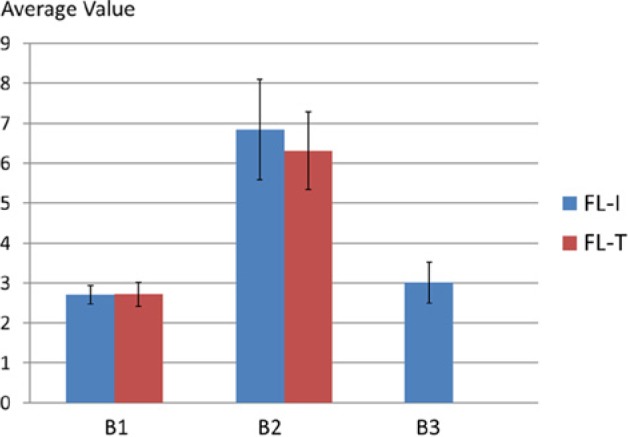
Average numbers of meal events (B1), food records (B2), and images (B3) per day. The error bars represent the 95% confidence intervals.
Figure 7 shows the histogram of the ratios of the average number of records made by individuals using FL-I relative to those made using FL-T.
Figure 7.
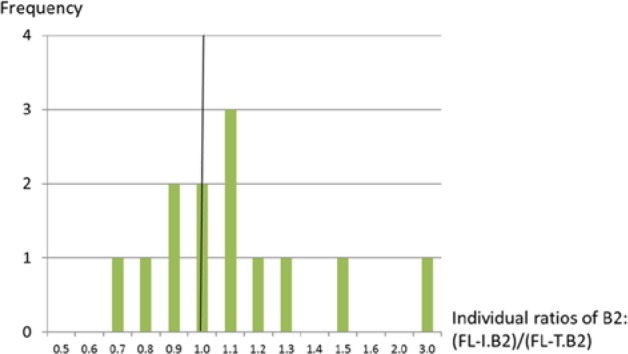
Histogram showing ratios of the average number of records (B2) made by individuals using FL-I relative to those made using FL-T. Ratios > 1.0 indicate that more food records were captured using FL-I than FL-T.
Discussion
To the best of our knowledge, FoodLog is the first publicly available smartphone app that allows image retrieval to help the user to input food records. The food diary display also makes full use of photos, which is visually appealing. This is the first study to compare the usability of image-assisted food recording with standard text-based food recording.
The subjective evaluation detected significant differences in the responses to questions A2, A3, and A4 for FL-I and FL-T. The remarkable difference between FL-I and FL-T for question A2 indicated that all of the participants had fun when using FL-I. The responses to question A3 showed that the participants browsed their food records more frequently with FL-I than FL-T. The responses to question A4 showed that the participants were more positive about their intention to continue using FL-I than FL-T. These results are very encouraging for the further improvement of FL-I. In their comments, 6 of the participants wrote that they had fun when using the tool and they frequently browsed the food photos in their records.
The difference in the responses to question A1 was not statistically significant, but FL-I received a better average score than FL-T, and the analysis of the individual scores presented in Figure 5 shows that more participants tended to consider that FL-I was easier to use than FL-T. The comments made by the participants who rated FL-T more highly than FL-I indicated that they sometimes experienced discomfort if they had to take photos of meals. Thus, using the system for 2 weeks might not have been sufficient to become accustomed to its use.
The daily activities of the participants were assessed in the quantitative evaluation. FL-I and FL-T were used at the same frequency based on the average number of daily meal events recorded. In addition, the average number of food records did not differ between the 2 methods. However, the distribution of the individual variations shown in Figure 7 indicates that FL-I users tended to generate more food records, and 1 of the participants produced 3 times as many records using FL-I compared with FL-T. Thus, FL-I appeared to be effective in encouraging the generation of food records.
Finally, the comments in the questionnaires indicated that 5 participants considered that using the system made them more aware of what they eat and the calorific contents of foods, although they had no previous experiences of food recording before the experiments. Six participants suggested that the interaction with the FL-I interface could be improved, and 4 indicated that the variety of food items in the common standard dataset should be increased.
Conclusion
Self-monitoring and dietary control play important roles in the prevention of obesity. The use of smartphones has spread rapidly throughout society and they have become highly personal devices for many people. Self-monitoring tools based on smartphones are available to monitor various daily activities, such as exercise, food, and sleep, as well as vital signs data. Food recording is a time-consuming and challenging task even when such tools are used. In this study, we evaluated our new food recording tool, FoodLog, which helps users to input data based on image retrieval. We evaluated the diet-related behaviors of participants for 1 month using food recording tools with and without image assistance, which were compared based on a subjective assessment and a quantitative evaluation. The subjective assessment detected significant differences between the 2 methods. We obtained promising results for the new tool with image-based assistance during regular daily use. Further improvements of this tool may facilitate better dietary self-management and monitoring by a third party, which could be beneficial for the general population.
In this study, the subjects were healthy university students because our evaluation was simply a usability study, which assessed the food recording tool with/without image assistance. The tool could be beneficial in situations that require the recording of food intake. FoodLog can be used independently or it may be integrated into a system with other functions, such as the management of exercise and vital signs. It can also be targeted at subjects with obesity or diabetes to facilitate self-management or monitoring by a third party. A separate study is evaluating a system for diabetics that integrated FoodLog.
Footnotes
Abbreviations: FL-I, FoodLog with image-based assistance; FL-T, FoodLog with text-based input only; PDA, personal digital assistant.
Declaration of Conflicting Interests: The author(s) declared no potential conflicts of interest with respect to the research, authorship, and/or publication of this article.
Funding: The author(s) disclosed receipt of the following financial support for the research, authorship, and/or publication of this article: This work was funded by CREST via JST and by a Grant-in-Aid for Scientific Research (B) from JSPS.
References
- 1. Thompson FE, Subar AF, Loria CM, Reedy JL, Baranowski T. Need for technological innovation in dietary assessment. J Am Diet Assoc. 2010;110(1):48-51. [DOI] [PMC free article] [PubMed] [Google Scholar]
- 2. Martin CK, Han H, Coulon SM, Allen HR, Champagne CM, Anton SD. A novel method to remotely measure food intake of free-living individuals in real time: the remote food photography method. Br J Nutr. 2009;101:446-456. [DOI] [PMC free article] [PubMed] [Google Scholar]
- 3. Khanna N, Boushey CJ, Kerr D, Okos M, Ebert DS, Delp EJ. An overview of the Technology Assisted Dietary Assessment Project at Purdue University. IEEE Int Symp Multimedia. 2010;290-295. [DOI] [PMC free article] [PubMed] [Google Scholar]
- 4. Boushey CJ, Kerr DA, Wright J, Lutes KD, Ebert DS, Delp EJ. Use of technology in children’s dietary assessment. Eur J Clin Nutr. 2009;63(suppl 1):S50-S57. [DOI] [PMC free article] [PubMed] [Google Scholar]
- 5. Carter MC, Burley VJ, Nykjaer C, Cade JE. “My Meal Mate” (MMM): validation of the diet measures captured on a smartphone application to facilitate weight loss. Br J Nutr. 2013;109:539-546. [DOI] [PubMed] [Google Scholar]
- 6. Tran J, Tran R, White JR., Jr Smartphone-based glucose monitors and applications in the management of diabetes: an overview of 10 salient “apps” and a novel smartphone-connected blood glucose monitor. Clin Diabetes. 2012;30(4):173-178. [Google Scholar]
- 7. Villalobos G, Almaghrabi R, Hariri B, Shirrmohammadi S, A personal assistive system for nutrient intake monitoring, Int ACM Workshop Ubiqutous Meta Interfaces, 2011:17-22. [Google Scholar]
- 8. Zhu F, Bosch M, Woo I, et al. The use of mobile devices in aiding dietary assessment and evaluation. IEEE J Selected Topics Signal Processing. 2010;4(4):756-766. [DOI] [PMC free article] [PubMed] [Google Scholar]
- 9. Noronha J, Hysen E, Zhang H, Gajos KZ. PlateMate: crowdsourcing nutrition analysis from food photographs. ACM Symp User Interface Software Technol. 2011;1-12. [Google Scholar]
- 10. Lee CD, Chae J, Shap TE, et al. Comparison of known food weights with image-based portion size automated estimation and adolescents’ self-reported portion size. J Diabetes Sci Technol. 2012;6(2):428-434. [DOI] [PMC free article] [PubMed] [Google Scholar]


