
Figure 4.
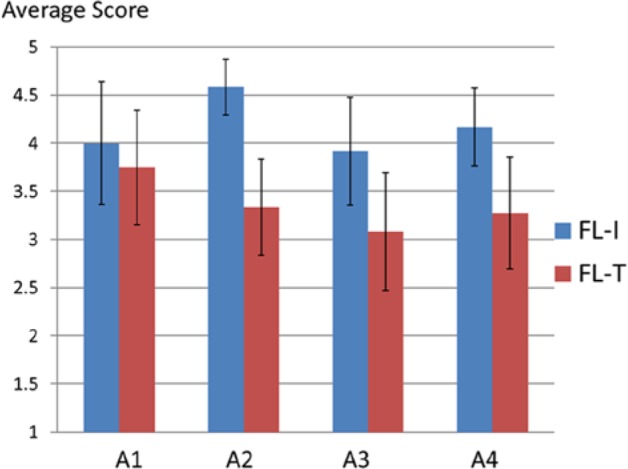
Subjective evaluation results, showing the average scores for ease of use (A1), fun (A2), frequency of browsing (A3), and intention to continue use (A4). The error bars represent the 95% confidence intervals.
Official websites use .gov
A
.gov website belongs to an official
government organization in the United States.
Secure .gov websites use HTTPS
A lock (
) or https:// means you've safely
connected to the .gov website. Share sensitive
information only on official, secure websites.
Subjective evaluation results, showing the average scores for ease of use (A1), fun (A2), frequency of browsing (A3), and intention to continue use (A4). The error bars represent the 95% confidence intervals.