
Figure 5.
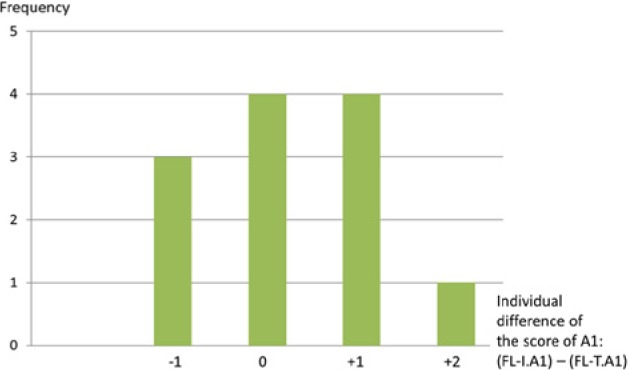
Histogram showing the individual differences in the scores for question A1, that is, the score for FL-I minus that for FL-T. The positive scores indicate that FL-I received better evaluations than FL-T.
Official websites use .gov
A
.gov website belongs to an official
government organization in the United States.
Secure .gov websites use HTTPS
A lock (
) or https:// means you've safely
connected to the .gov website. Share sensitive
information only on official, secure websites.
Histogram showing the individual differences in the scores for question A1, that is, the score for FL-I minus that for FL-T. The positive scores indicate that FL-I received better evaluations than FL-T.