
Figure 7.
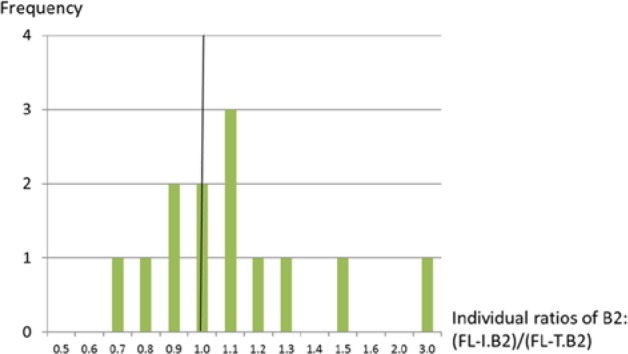
Histogram showing ratios of the average number of records (B2) made by individuals using FL-I relative to those made using FL-T. Ratios > 1.0 indicate that more food records were captured using FL-I than FL-T.
Official websites use .gov
A
.gov website belongs to an official
government organization in the United States.
Secure .gov websites use HTTPS
A lock (
) or https:// means you've safely
connected to the .gov website. Share sensitive
information only on official, secure websites.
Histogram showing ratios of the average number of records (B2) made by individuals using FL-I relative to those made using FL-T. Ratios > 1.0 indicate that more food records were captured using FL-I than FL-T.