
Figure 2.
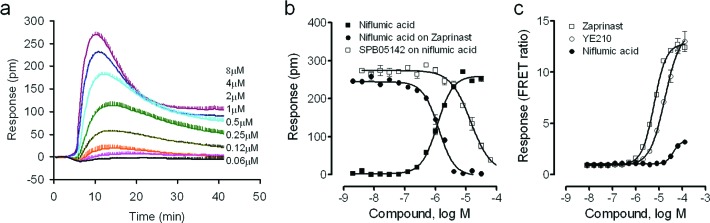
Pharmacological characterization of niflumic acid. (a) Real time kinetic responses of niflumic acid at different doses in HT-29 cells. (b) DMR amplitudes of niflumic acid as a function of its doses, in comparison with the dose-dependent desensitization of the zaprinast DMR by niflumic acid, and the dose-dependent inhibition of the DMR of 8 μM niflumic acid by SPB05142. The DMR amplitudes 10 min poststimulation in HT-29 cells were calculated for all. (c) Dose-dependent responses of niflumic acid, zaprinast, and YE210 as measured by Tango β-arrestin translocation gene reporter assays. The coumarin-to-fluorescein ratios were plotted as a function of ligand doses. The data represents mean ± s.d. from two independent measurements, each in duplicate (n = 4).