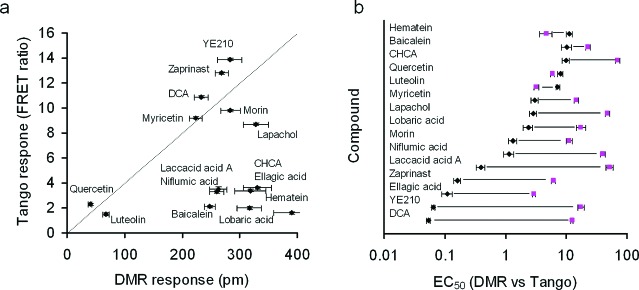
Figure 5.

Correlation analyses between DMR and Tango assays. (a) Maximal responses of all agonists. (b) EC50 values (in μM) of all agonists. The pink squares indicate the EC50 obtained using Tango assays, and the black diamonds the EC50 obtained using DMR assays. The data represents mean ± s.d. from two independent measurements, each in duplicate (n = 4).
