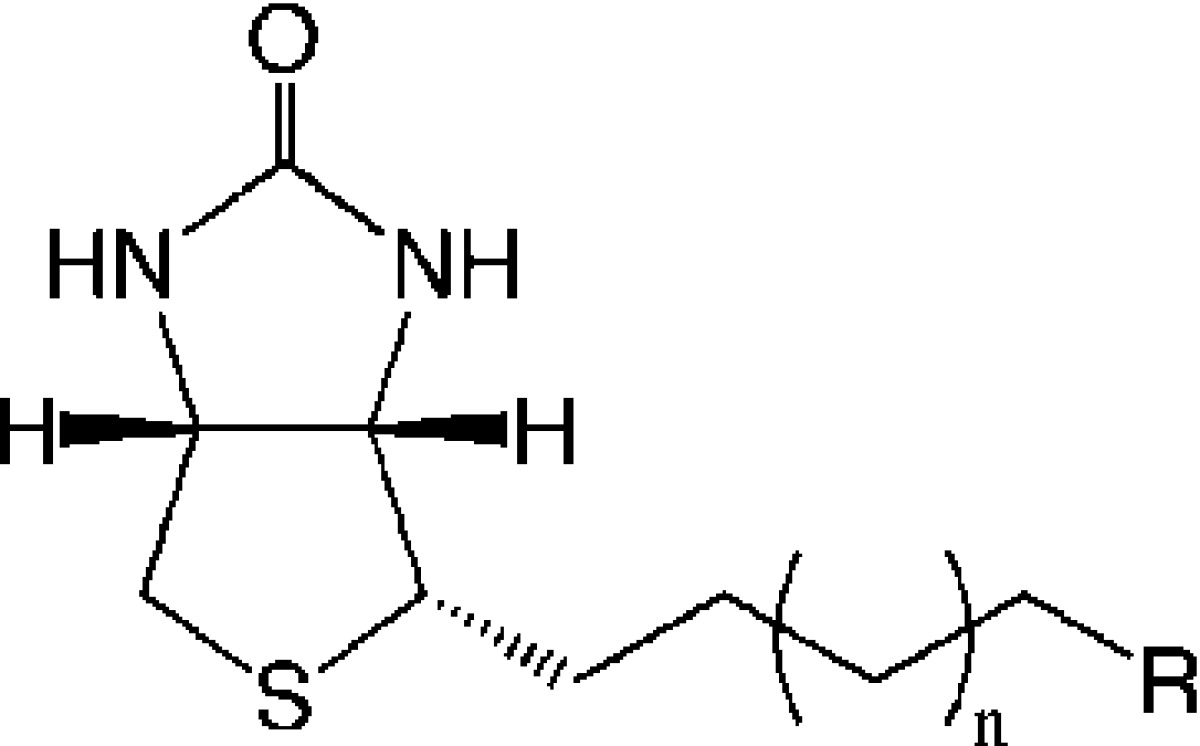
Table 1. SAR Data for the Biotin Analogue Seriesa.

|
S. aureus |
E. coli |
H. sapiens | selectivityc | |||||
|---|---|---|---|---|---|---|---|---|
| ID | n | R | Ki (μM) | LEb | Ki (μM) | LEb | Ki (μM) | Hs vs Sa/Ec vs Hs/Ec vs Sa |
| 6 | 2 | OH | 3.37 ± 0.3 | 0.52 | 3.96 ± 0.4 | 0.51 | 3.85 ± 0.3 | 1.1/1.0/1.2 |
| 7 | 3 | OH | >20 | ND | >20 | ND | >20 | ND |
| 3 | 1 | NH2 | >20 | ND | >20 | ND | >20 | ND |
| 11 | 2 | NH2 | >20 | ND | >20 | ND | >20 | ND |
| 16 | 1 | CH3 | 0.05 ± 0.01 | 0.69 | 1.10 ± 0.12 | 0.56 | 0.14 ± 0.02 | 2.8/7.9/22 |
| 17 | 2 | CH3 | 0.52 ± 0.06 | 0.56 | 7.30 ± 1.9 | 0.46 | 6.43 ± 1.4 | 12.4/1.1/14 |
| 5 | 1 | C≡CH | 0.08 ± 0.01 | 0.67 | 0.90 ± 0.1 | 0.57 | 0.2 ± 0.03 | 2.5/4.5/11.3 |
| 14 | 2 | C≡CH | 0.3 ± 0.05 | 0.58 | 7.33 ± 1.0 | 0.46 | 3.50 ± 0.5 | 11.7/2.1/24.4 |
| 15 | 3 | C≡CH | 2.40 ± 0.02 | 0.47 | 20.0 ± 0.3 | 0.39 | 12.0 ± 1.83 | 5/1.7/8.3 |
A SAR series was investigated based upon the pharmacophore shown above. Compounds were assayed against BPLs from three species and where inhibition was observed Ki values are reported. Each Ki value is the mean (±standard error) of three independent experiments.
LE is ligand efficiency in kcal K–1 mol–1 per heavy atom.
Selectivity is expressed as ratios of Ki values. Sa is S. aureus BPL, Ec is E. coli BPL, and Hs is H. sapiens BPL.
