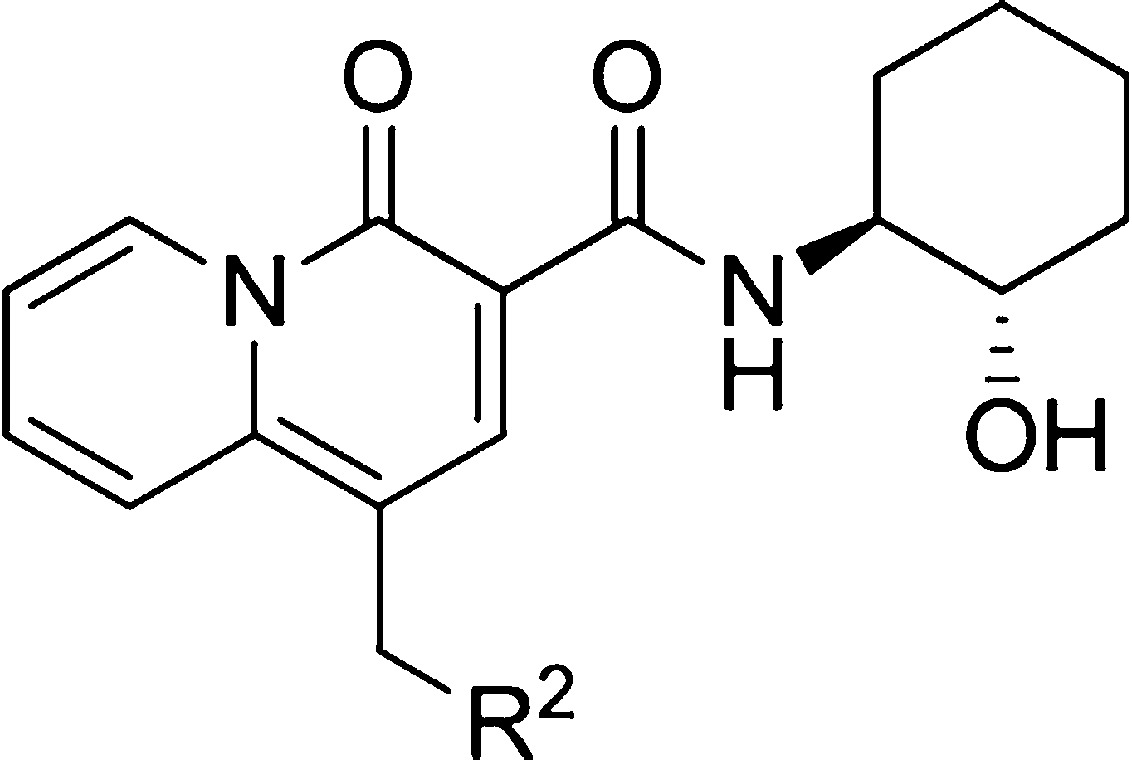
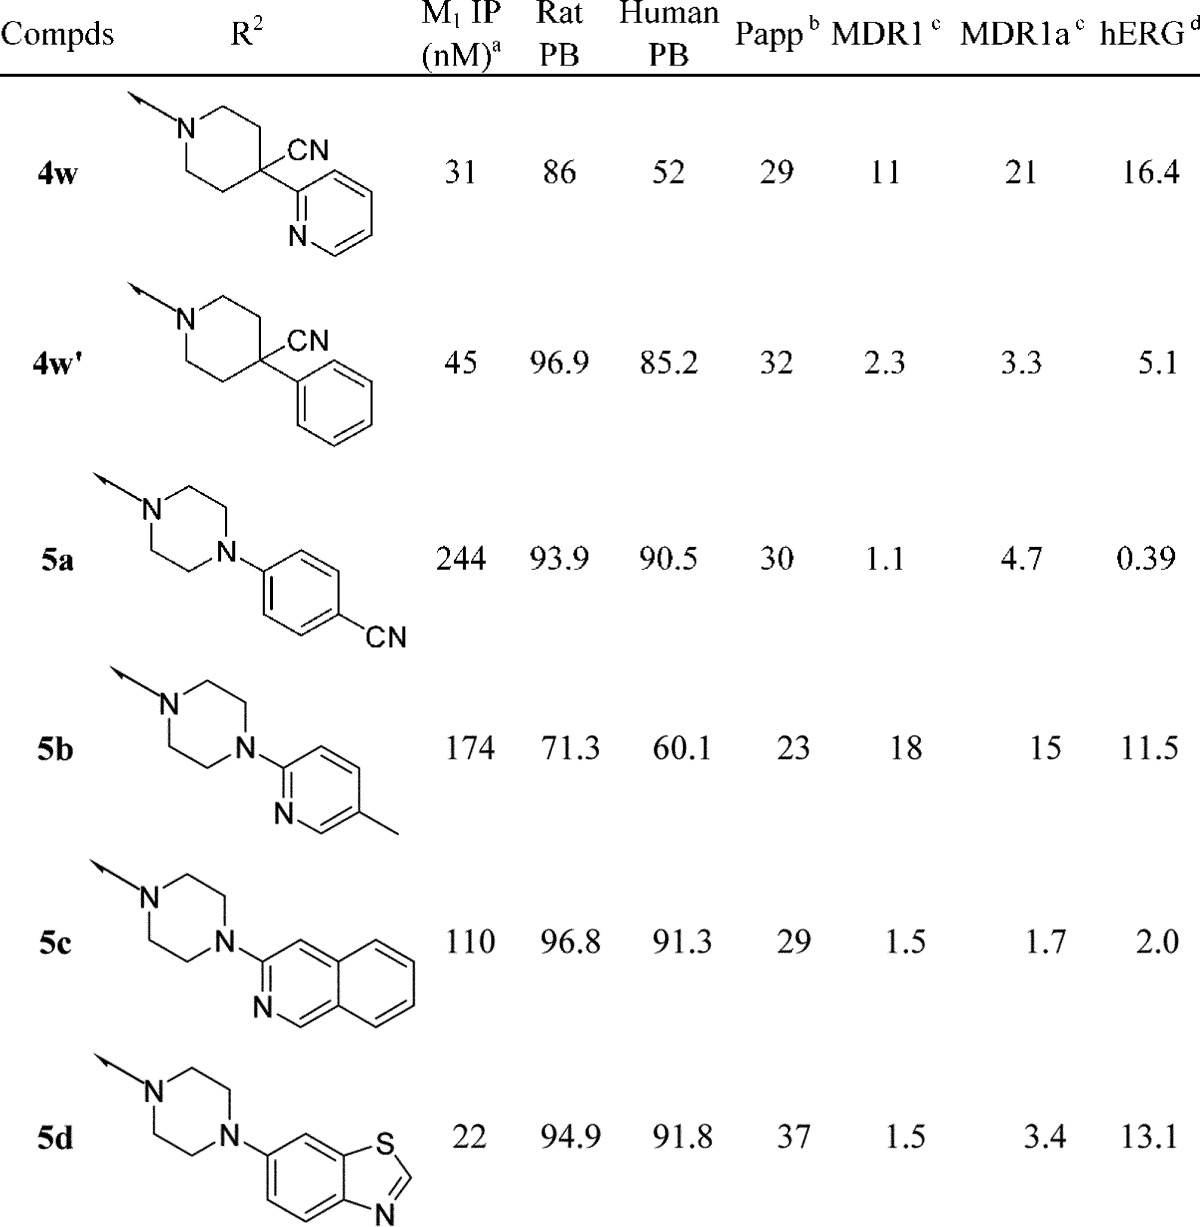
Table 3. M1 FLIPR, Protein Binding, P-gp, and hERG Data for Select Compounds.


Values represent the numerical average of at least two experiments. The interassay variability was ±30% (IP, nM), unless otherwise noted.
Passive permeability (10–6 cm/s) in Madin Darby canine kidney (MDCK) cells.
MDR1 directional transport ratio (B to A)/(A to B). Values represent the average of three experiments, and the interassay variability was ±20%.
Values represent the numerical average of at least two experiments. The interassay variability was ±20% (IC50, μM).
