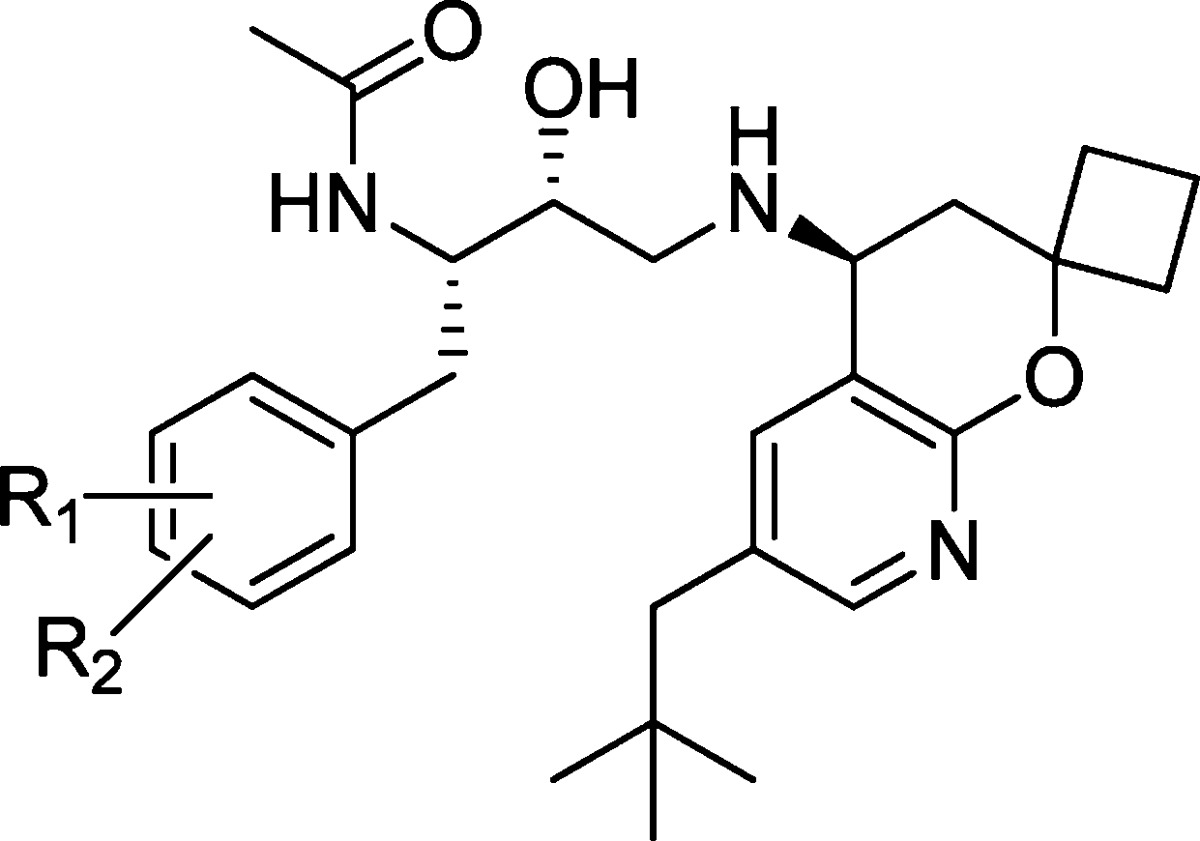
Table 1. SAR of Phenyl Ring Substituentsa.

| μL/min/mgd |
|||||||
|---|---|---|---|---|---|---|---|
| compdb | R1 | R2 | BACE IC50 (nM)c | cell IC50 (nM)a | RLM | HLM | LLC-PK1 Papp (×10–6 cm/s) |
| 4 | H | H | 5.8 ± 6.3 | 3.1 ± 4.2 | 241 | 465 | 22 |
| 16 | 4-F | H | 5.0 ± 3.0 | 12 ± 6.1 | 180 | 107 | 21 |
| 17 | 3-F | H | 1.0 ± 0.47 | 1.8 ± 1.2 | 227 | 621 | 16 |
| 18 | 2-F | H | 3.6 ± 0.86 | 5.1 ± 4.3 | 206 | 342 | 13 |
| 19 | 4-Cl | H | 8.3 ± 2.7 | 13 ± 9.1 | 160 | 443 | 21 |
| 20 | 4-OCF3 | H | 14 ± 1.3 | 65 ± 4.3 | 101 | 181 | |
| 21 | 3-F | 5-F | 6.9 ± 8.7 | 6.6 ± 7.5 | 186 | 921 | 15 |
| 22 | 3-CF3 | H | 2.4 ± 0.97 | 4.0 ± 1.6 | 179 | 308 | 12 |
| 23 | 4-F | 2-F | 6.5 ± 5.3 | 18 ± 0.41 | 173 | 71 | |
| 24 | 4-F | 3-F | 2.0 | 2.4 ± 1.1 | 16 | ||
| 25 | 4-F | 3-CH3 | 4.0 ± 3.0 | 4.6 ± 2.6 | >399 | 829 | 15 |
| 26 | 4-F | 3-CF3 | 11 ± 14 | 18 ± 8.8 | 116 | 134 | 12 |
| 27 | 4-F | 3-OCF3 | 2.1 | 26 ± 18 | 220 | 360 | 8.6 |
| 28 | 4-F | 3-CN | 2.4 ± 0.06 | 4.5 ± 1.1 | 185 | 188 | |
| 29 | 4-F | 3-OCH3 | 4.5 ± 0.99 | 7.6 ± 3.4 | 165 | 628 | 20 |
| 30 | 4-CH3 | 3-F | 0.99 ± 0.37 | 2.2 ± 0.82 | 155 | >399 | 18 |
| 31 | 4-OCH3 | 3-F | 3.6 ± 0.73 | 8.5 ± 6.4 | 258 | 162 | 28 |
| 32c | 4-CF3 | 3-F | 44 ± 11 | 160 | 121 | 443 | 16 |
All values lacking standard deviations were measured as single data points.
All compounds were >95% pure by HPLC and characterized by 1H NMR and HRMS.
Compound is mixture of diastereomers (1:1, 2S,3R and 2R,3S).
Compounds are incubated with microsomes for 30 min at a concentration of 1 μM.
