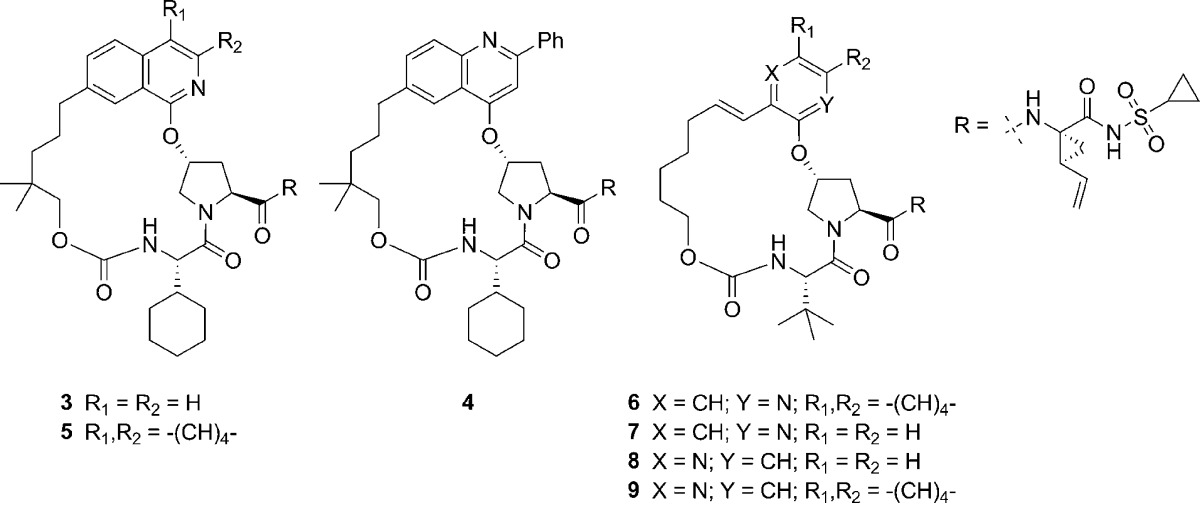
Table 1. In Vitro Activity.

|
Ki (nM)a |
||||
|---|---|---|---|---|
| compd | 1b | 3a | 1b replicon IC50 50% NHS (nM)b | rat [liver] at 4 h (μM)c |
| 3 | 0.02 | 200 | 10 | 21 |
| 4 | 0.05 | 45 | 19 | 7.8 |
| 5 | 0.05 | 12 | 19 | 96 |
| 6 | 0.06 | 130 | 21 | 25 |
| 7 | 1.1 | 1200 | ND | ND |
| 8 | 1.9 | 520 | ND | ND |
| 9 | 0.08 | 26 | 44 | 0.6 |
NS3/4a protease time-resolved fluorescence assay, mean of n ≥ 3 measurements.
Cell-based replicon assay, mean of n ≥ 3.
Liver levels from PK experiments described in the Supporting Information.
