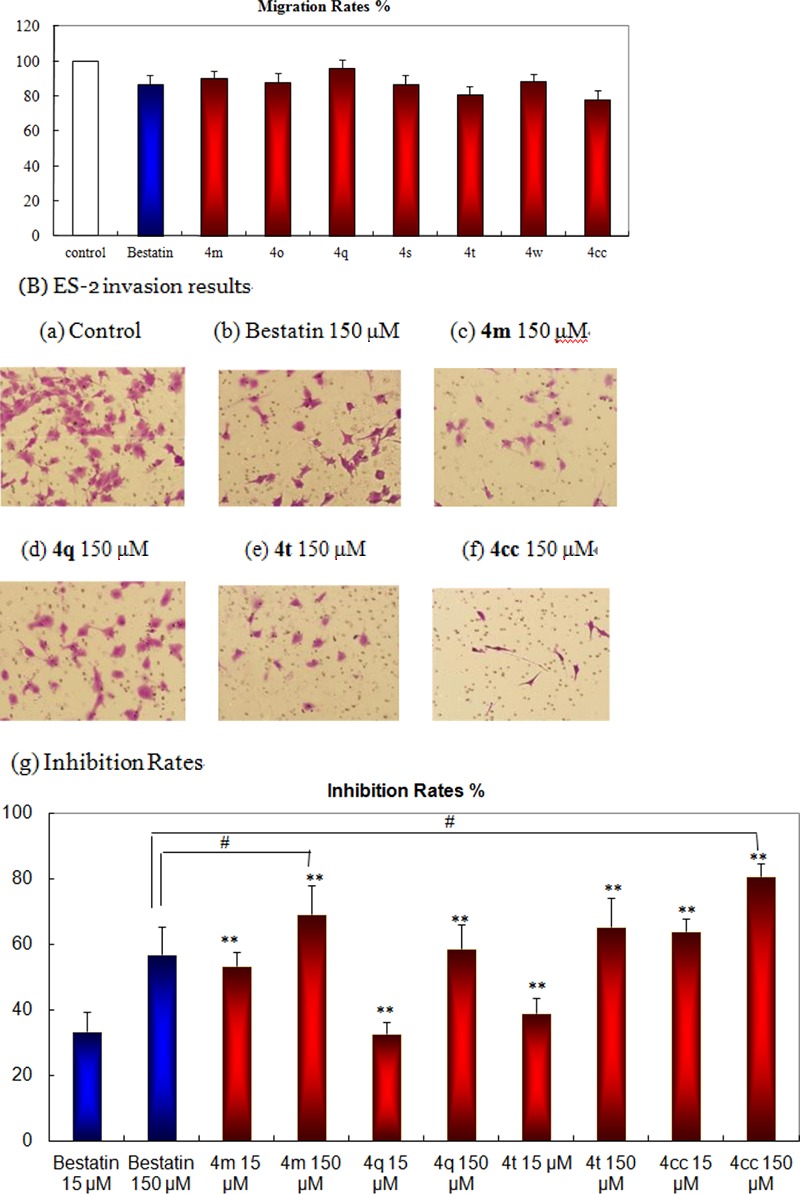
Figure 2.

(A) ES-2 cell migration. (B) ES-2 cell invasion inhibition: (a) control; (b) bestatin 150 μM; (c) 4m, 150 μM; (d) 4q, 150 μM; (e) 4t, 150 μM; (f) 4cc, 150 μM; (g) statistical chart. Each column represents the mean values with SD for three independent experiments.***, P < 0.001; **, P < 0.01; *, P < 0.05, versus the control. ###, P < 0.001; ##, P < 0.01; #, P < 0.05, versus Bestatin treated groups.
