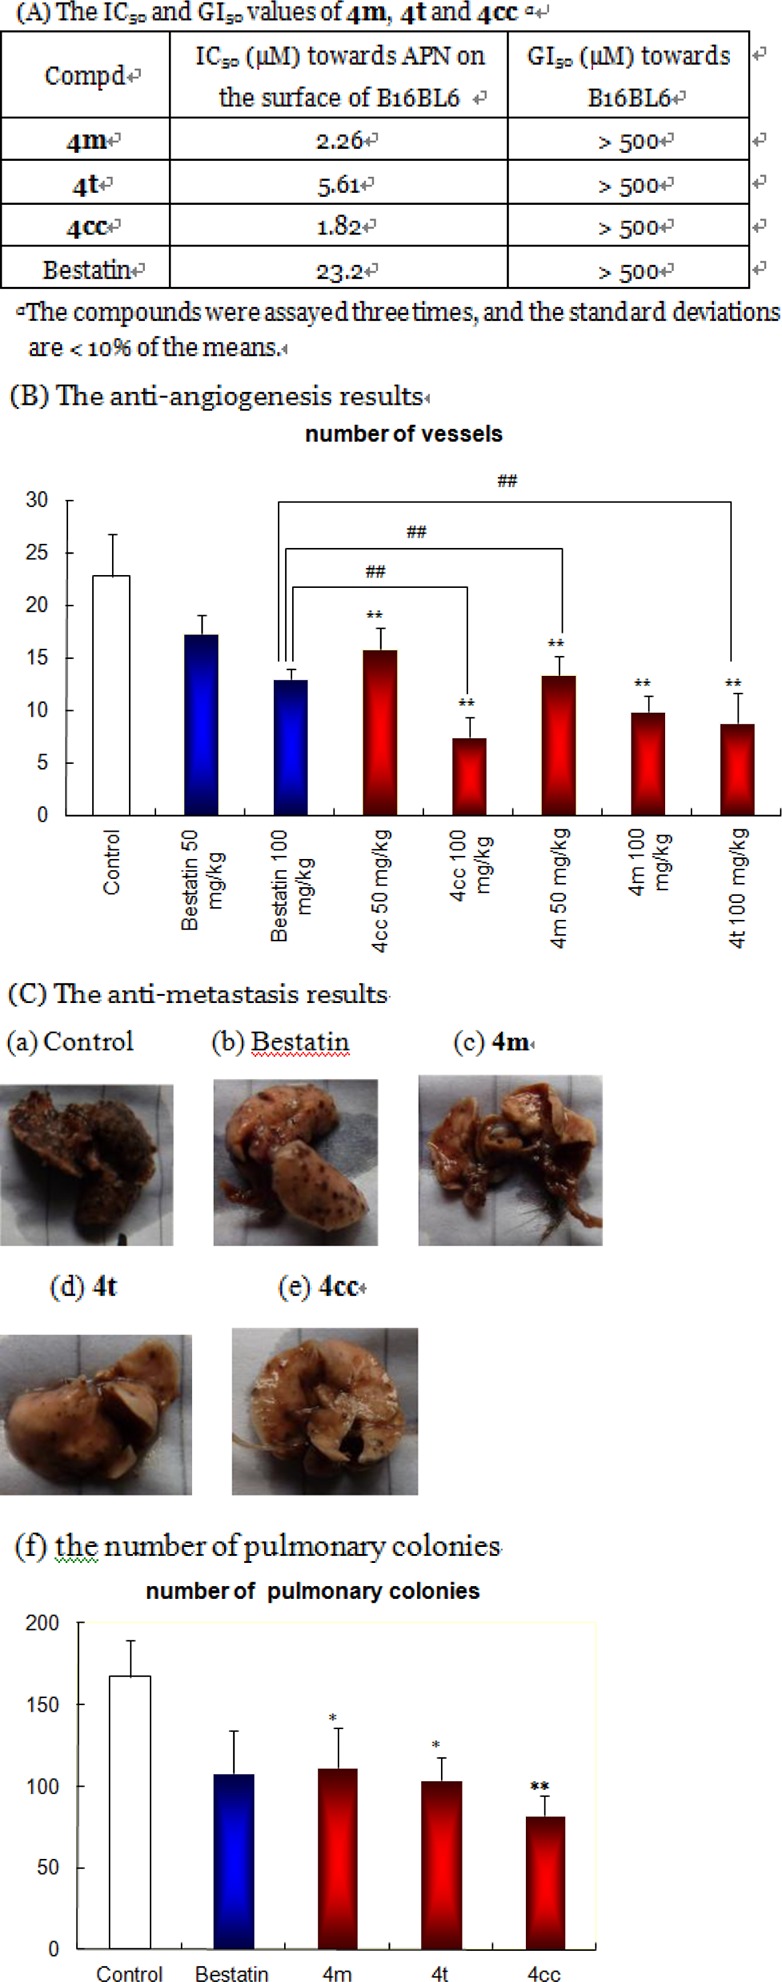
Figure 3.

(A) The IC50 and GI50 values of 4m, 4t, and 4cc. (B) 4m, 4t, and 4cc inhibit B16BL6 induced angiogenesis in vivo. **, P < 0.01, versus the control. ##, P < 0.01, versus bestatin treated groups. (C) B16BL6 pulmonary colonies. (a) Control, (b) bestatin, (c) 4m, (d) 4t, (e) 4cc, (f) statistical chart. Each column represents the mean values with SD *, P < 0.05, versus the control, **, P < 0.01, versus the control.
