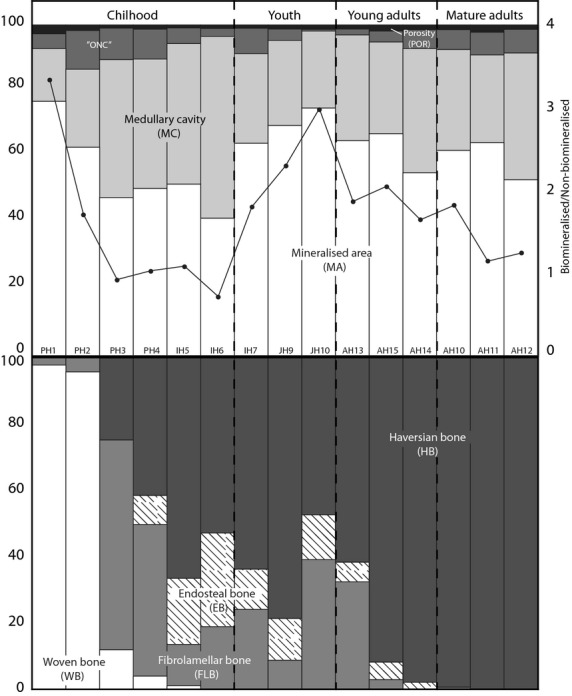
Figure 6.

Compartmentalisation (upper) and bone tissue typology (bottom) variation during growth. Adult individuals appear ordered, supporting our proposal (see Discussion for details). In the upper plot, the black line represents the ratio between the mineralised (MA) and non-mineralised areas (MC + vascularisation). The bottom plot represents the percentages of different bone tissues, establishing the difference between modelling (bottom left) and remodelling (upper right).
