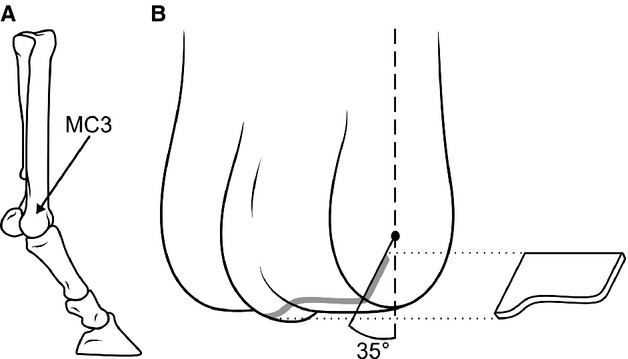
Figure 1.

Schematics demonstrating sampling location. (A) Schematic showing the MC3 in context of the distal equine forelimb. (B) Schematic of the distal end of MC3 indicating the region of interest in the palmar aspect, the black dot in the centre representing an approximation of the centre of rotation of the distal MC3. Exploded section approximates an osteochondral slab from which sections were taken for microscopic.
