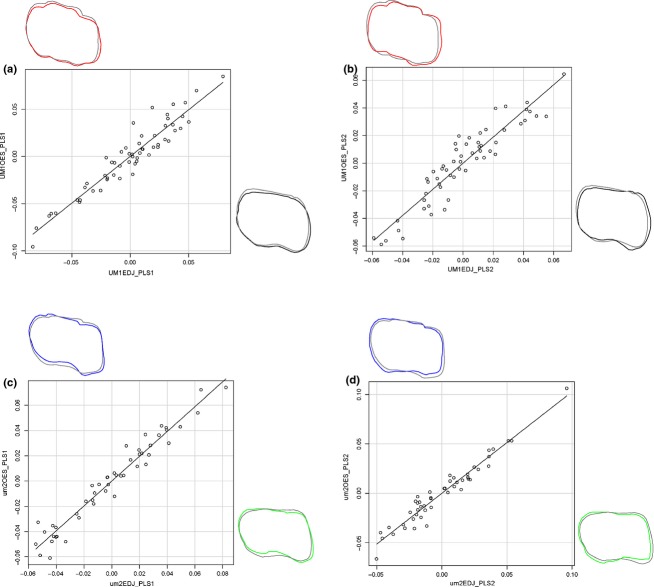
Figure 2.
Scatter plots representing the first and second pairs of PLS axes between EDJ and OES within the same tooth class. (a) PLS1 UM1, (b) PLS2 UM1, (c) PLS1 um2, (d) PLS2 um2. Shape deformation corresponding to each axis is provided to the left of x-axes or above y-axes. Each shape deformation is represented in colored line whose scale factor used for is 0.1 and mean shape is represented with a gray line.

