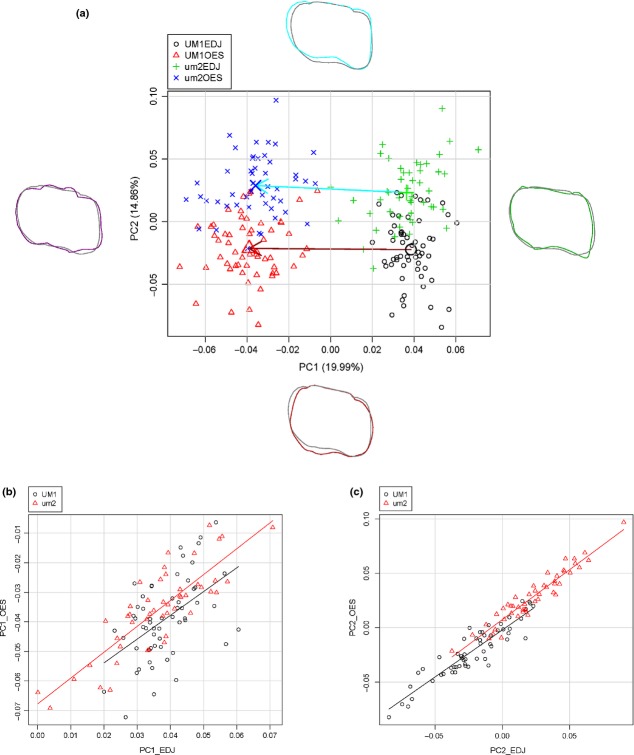
Figure 3.
Principal component plots for shape variation between EDJ and OES of both UM1 and um2. (a) Plots of PC1 vs. PC2 scores. Variance explained by PC1 and PC2 is 34.85% of total variance. Shape deformation corresponding to the positive or negative loadings of each axis is provided to the left and right for x-axes or the above and bottom for y-axes. Each shape deformation is represented with a coloured line whose scale factor used for is 0.1 and mean shape is represented with a gray line. Arrows show morphological change vectors from mean shape represented in large symbols of EDJ to that of OES for each tooth class. (b) Relationship between EDJ and OES for PC1 in both UM1 and um2. The slope and intercept of the regression line for UM1 are 0.804 and −0.070, respectively (r = 0.51, P < 0.001). The slope and intercept of the regression line for um2 are 0.876 and −0.068, respectively (r = 0.84, P < 0.001). (c) Relationship between EDJ and OES for PC2 in both UM1 and um2. The slope and intercept of the regression line for UM1 are 0.863 and −0.002, respectively (r = 0.92, P < 0.001). The slope and intercept of the regression line for um2 are 0.918 and 0.007, respectively (r = 0.95, P < 0.001).

