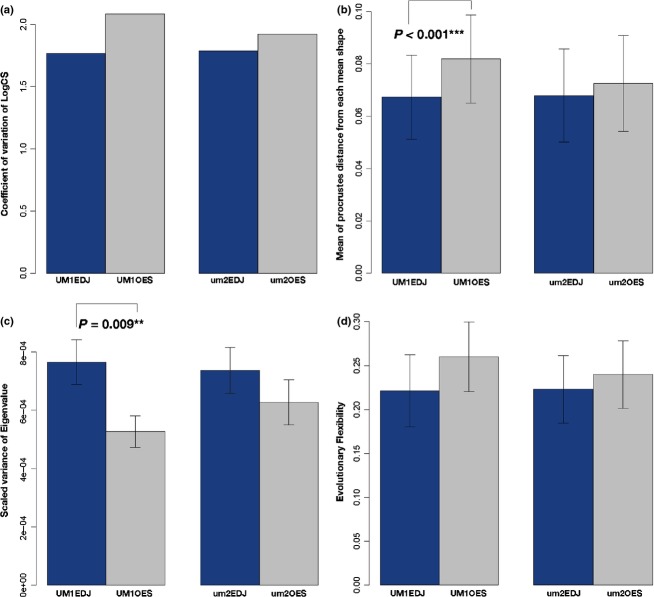
Figure 4.
(a) Bar graph showing the size variation for four configurations (UM1EDJ, UM1OES, um2EDJ, and um2OES). Significance test for coefficient of variation for LogCS among them reveals that there is no significant difference (P > 0.05). (b) Bar graph showing mean of Procrustes distance from each mean shape for shape variance of four configurations (UM1EDJ, UM1OES, um2EDJ, and um2OES), and the error bars show standard deviations. The Kruskal–Wallis test reveals a significant difference among them (P < 0.001). A nonparametric multiple-comparison test between EDJ and OES within the same tooth class reveals that the difference is highly significant in UM1 (P < 0.001). (c) Bar graph showing the scaled variances of eigenvalue for morphological integration for four configurations (UM1EDJ, UM1OES, um2EDJ, and um2OES). The error bars shown are standard deviations obtained by resampling the original datasets with 1000 iterations. Bootstrap tests between EDJ and OES within the same tooth class reveal that the difference is highly significant only in UM1 (P = 0.009). (d) Bar graph showing the evolutionary flexibility for four configurations (UM1EDJ, UM1OES, um2EDJ, and um2OES). The error bars shown are standard deviations obtained by resampling the original datasets with 1000 iterations. Bootstrap tests between EDJ and OES within the same tooth class reveal that there is no significant difference (P > 0.05).

