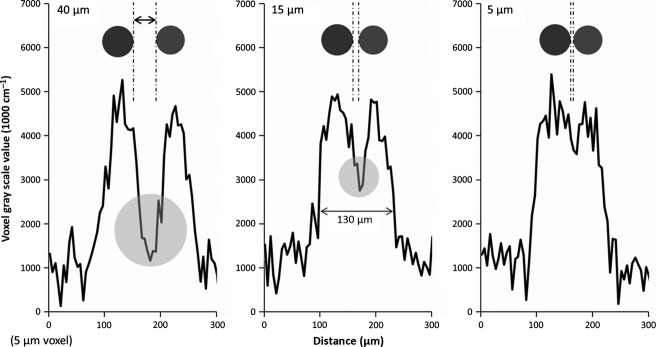
Figure 10.

Simulation of varying spacing between hepatic artery and portal vein. The simulations show the line profiles generated between adjacent hepatic artery (65 μm in diameter) and portal vein (50 μm in diameter) separated by varying lumen distances of 40 (left), 15 (middle) and 5 μm (right). The 40-μm result retains much of the dip (circle) resulting from the spacing between the two lumens. Even at a separation of 15 μm a dip in gray scale is still evident (circle in middle plot). At about 5 μm lumen distance (right) the vessels are indistinguishable. However, this separation does not represent the width of the measured shunt.
