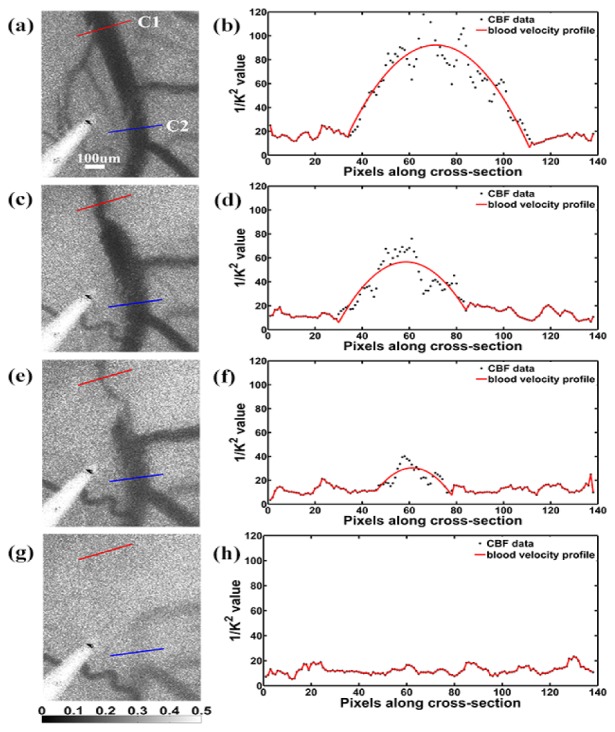
Fig. 3.

LSI images and the corresponding BVPs. (a), (c), (e) and (g) are LSI images at different time points in the photothrombosis process (t1 = 0 min, t2 = 6 min, t3 = 9 min, t4 = 10 min). The corresponding BVPs along the selected cross session C1 are shown in (b), (d), (f) and (h), respectively. The BVPs are fitted with parabolic curves. A cross section C2 (blue) far from the focus is selected for further comparison with C1 (red) in aspects of vessel diameter and centerline velocity.
