
Fig. 4.
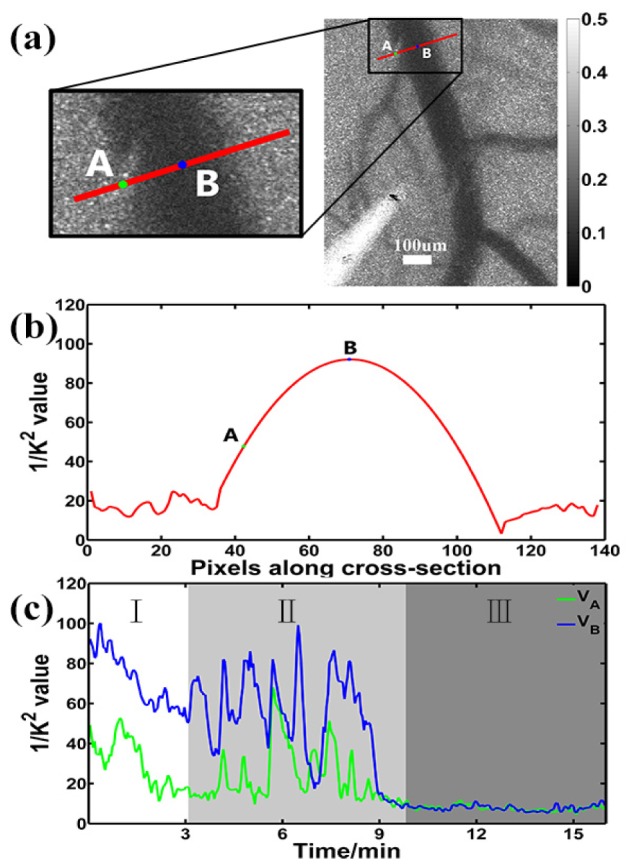
CBF changes at a single point during the photothrombosis process. (a), (b) Two selected points close to the vessel wall (point A) and centerline (point B) at the baseline along the cross section C1 were selected to demonstrate the changes in CBF during the thrombus formation. (c) Blood velocity changes of point A and point B, represented by and , are plotted during the photothrombosis process.