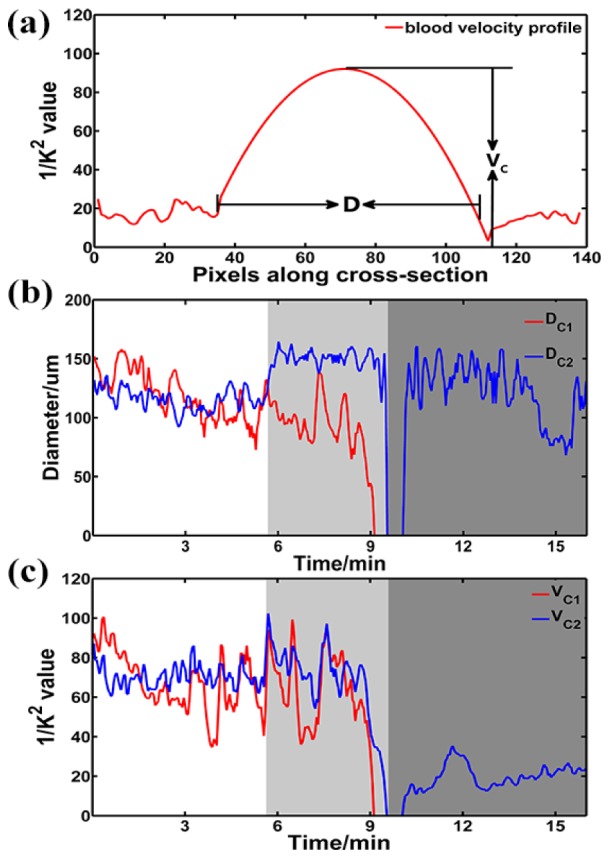
Fig. 5.

Changes in cerebral vessel diameter and the centerline velocity during the photothrombosis process at different locations. (a) Illustration of the definition of vessel diameter D and centerline velocity on BVP. (b) Vessel diameter changes at cross sections C1 and C2, denoted as and . (c) The centerline velocity, i.e. and , on cross sections C1 and C2.
