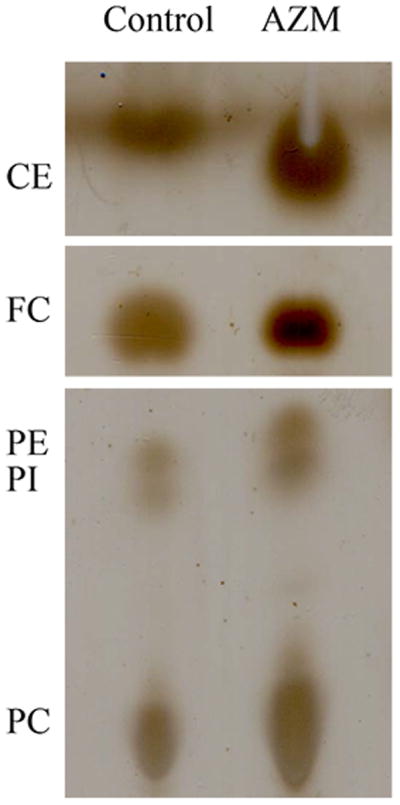
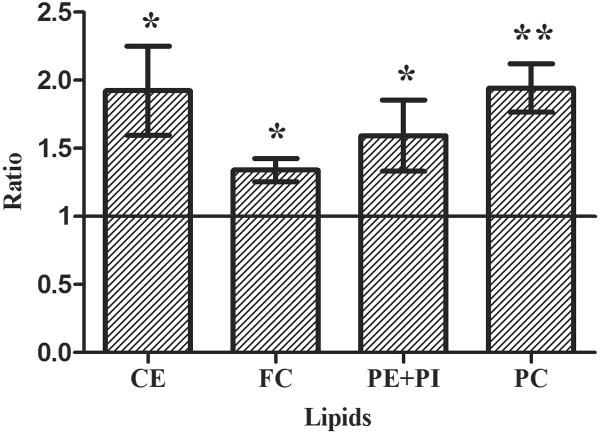
Figure 3. The effect of AZM on the expression of cholesterol ester (CE), free cholesterol (FC), phosphatidylethanolamine (PE) phosphatidylcholine (PC) and phosphatidylinositol (PI) in human meibomian gland epithelial cells.

a. Cells were treated with vehicle or 10μg/ml AZM for 5 days before performing chromatographic analyses of total lipid extracts. b. Band intensity was measured by using ImageJ; control band instensity was set to 1, and data (mean ± SE) are reported as fold-change compared to control values. *p < 0.05, **p < 0.005, versus control. Band intensity analysis includes data from at least three independent expreiments.

