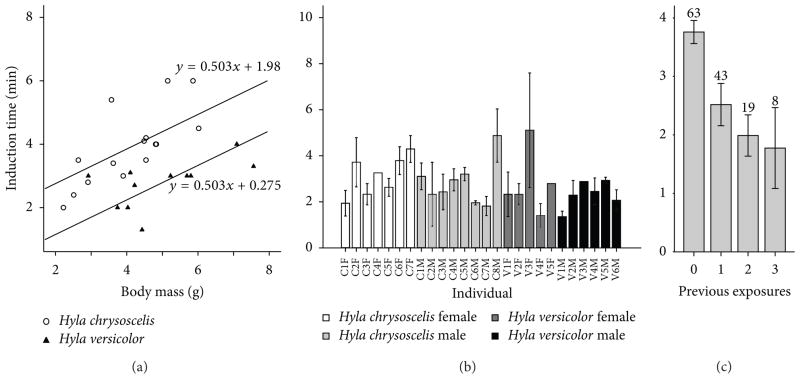
Figure 2.
Induction time of gray treefrogs anesthetized with TMS at 2 g/L and pH 7. (a) First exposure of the animal to TMS. Both the slope of the relationship between body mass and induction time and the difference in intercept between the two species are highly significant (P = 0.001 and P < 0.001, resp.). (b) Individual variation in induction time across multiple exposures to TMS. (c)The effect of number of previous exposures to TMS within the same day on induction time. In (b) and (c), bars represent means and error bars represent standard errors. Numbers above bars represent count of anesthesia events.

