
Fig 1.
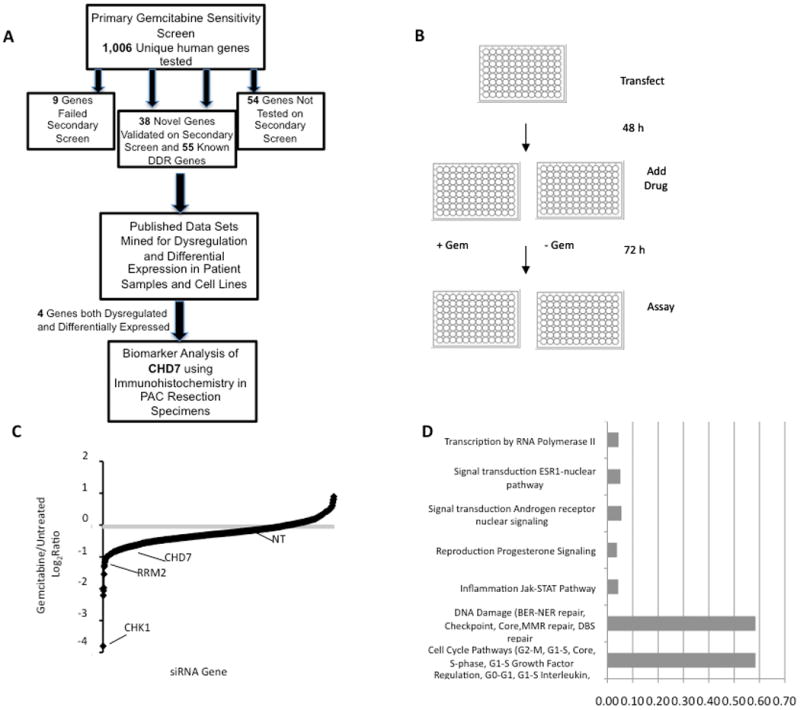
Primary gemcitabine sensitivity screen. (A) Flow diagram of approach for identifying novel biomarkers for outcome in early-stage resected PAC patients treated with adjuvant gemcitabine. (B) Diagram of primary screen as described in text. (C) Results of primary screen. The log2ratio of treated versus untreated cell viability relative to the non-targeting (NT) siRNA for each gene is shown. Mean from three replicas of primary screen is shown. (D) Proportion of top 15% of gemcitabine sensitivity genes with statistically significant involvement in known pathways. The top 18 pathways identified on network analysis via MetaCore ExPlain Process Network Analysis can be consolidated into the listed categories. 55% of all identified genes were involved in DDR pathways.