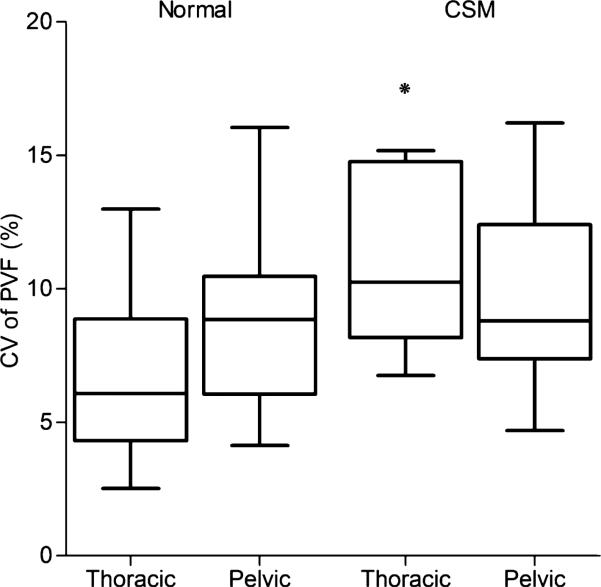
Fig 2.
Boxplot of the coefficient of variation in the PVF in normal and CSM-affected dogs. The box represents the interquartile range (25–75%), and the line in each box delineates the median value. Overall, CSM-affected dogs had a significantly higher variability in PVF versus normal dogs, but more specifically, in the thoracic limbs. *P = .0045; PVF, peak vertical force; CV, coefficient of variation; CSM, cervical spondylomyelopathy.

