
Figure 3.
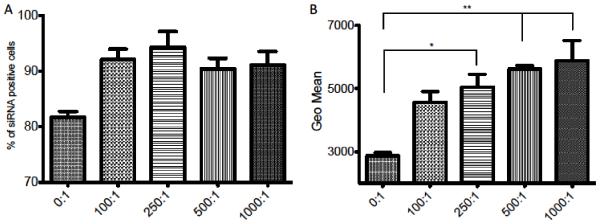
Cellular uptake of siRNA determined by FACS analysis in A2780 cell line using different MB:cell ratios. (A) Quantification of siRNA cellular uptake between siRNA positive and siRNA negative cells with 5 nM siRNA in SAM complexes and MB:cell ratios (0:1, 100:1, 250:1, 500:1, 1000:1, 0:1 = ABP-siRNA polyplex with no MBs) treated with 1 MHz US condition, 0.5 Watt/cm2 and 50% duty. (B) Quantification of siRNA per cell population using the GEO mean of groups from (A). Data represent mean ± SD and significance tested (P < 0.05 and 0.001) by one-way ANOVA and Tukey post test.