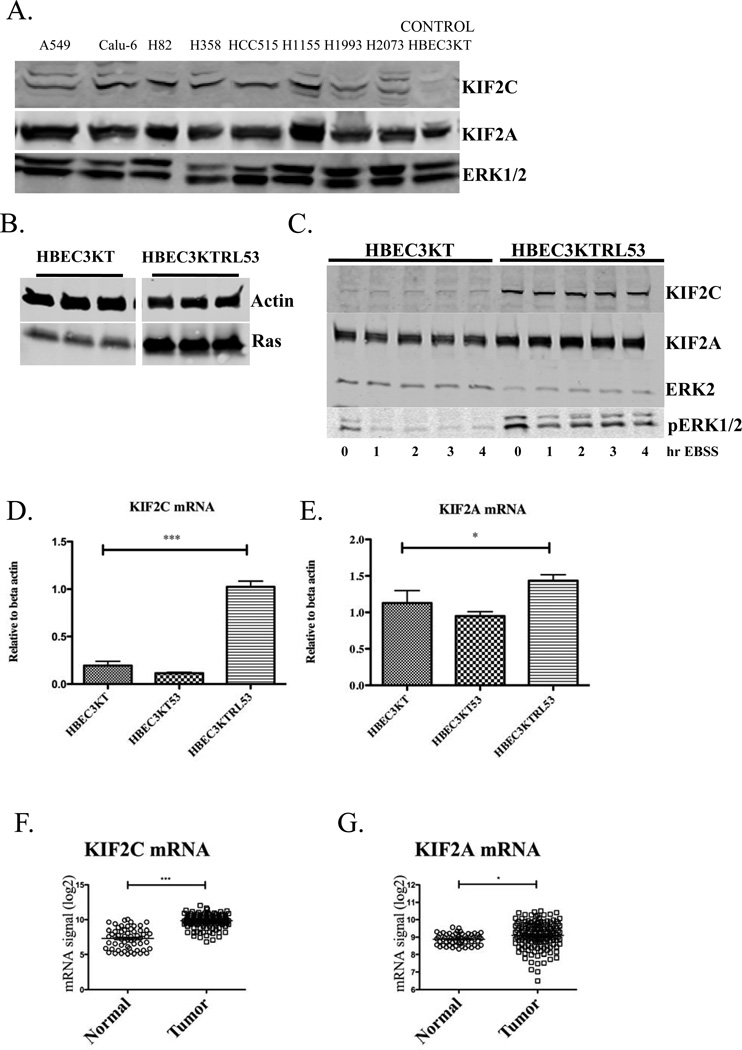
Fig. 1. Expression of kinesin 13 family proteins in cancer cell lines.
(A) KIF2A and KIF2C were detected by immunoblotting of lysate proteins from A549, Calu-6, H82, H358, HCC515, H1155, H1993, H2073, HBEC3KT analyzed on denaturing gels as in Methods. Immunoreactivity was detected with the LI-COR Odyssey infrared system. (B) K-Ras was immunoblotted in lysates from HBEC3KT and HBEC3KTRL53. These lanes are from ends of the same gel; irrelevant lanes in the middle were removed, indicated by a space. (C) HBEC3KT and HBEC3KTRL53 cells were starved in Earle’s Balanced Salt Solution (EBSS) for the specified times. Lysate proteins were resolved on a gel followed by immunoblotting with the indicated antibodies. (D) RNA was isolated from HBEC3KT, HBEC3KT53 and HBEC3KTRL53. KIF2C gene expression was measured by qPCR. p < 0.0001 by ANOVA (one-way analysis of variance). Tukey’s Multiple Comparison Test showed P < 0.05 for comparison between HBEC3KT vs HBEC3KTRL53 and HBEC3KT53 vs HBEC3KTRL53. (E) KIF2A gene expression with p = 0.045 by ANOVA. Tukey’s Multiple Comparison Test showed P < 0.05 for comparison between HBEC3KT53 vs HBEC3KTRL53. Microarray profile of tumor and normal cell lines for (F) KIF2C; p <0.0001 by two-tailed t test (G) KIF2A; p = 0.0022 by two-tailed t test.

