
Fig. 8.
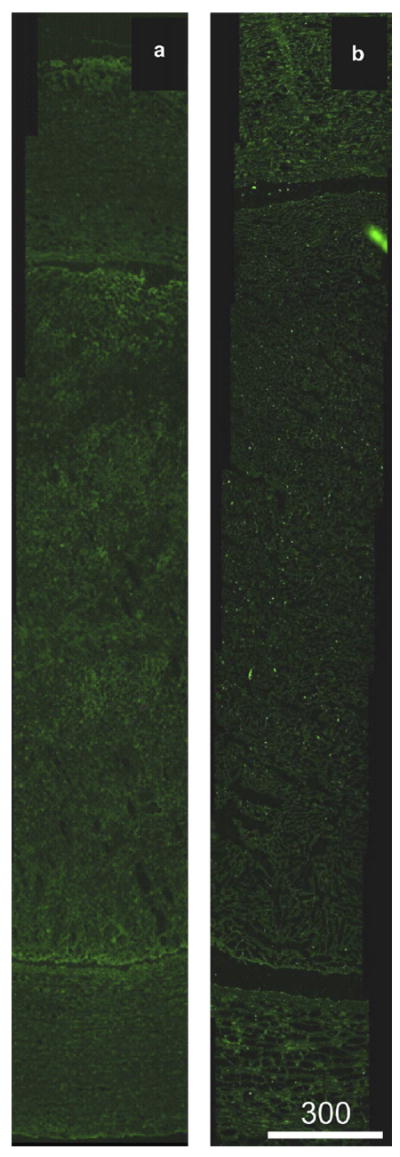
Representative fluorescence images of anti–t-PA-labeled arteries with luminal clot. (a) Clot treated with rt-PA (7.1 ± 3.8 μg/mL) and Definity microbubbles (0.79 ± 0.47 μL/mL) in flowing porcine plasma, with ultrasound exposure (120-kHz continuous wave at a 0.44-MPa peak-to-peak pressure amplitude). (b) Clot treated with rt-PA only. Note that although both arteries display abundant autofluorescence, the ultrasound-treated artery does not demonstrate enhanced rt-PA penetration into the arterial tissue.