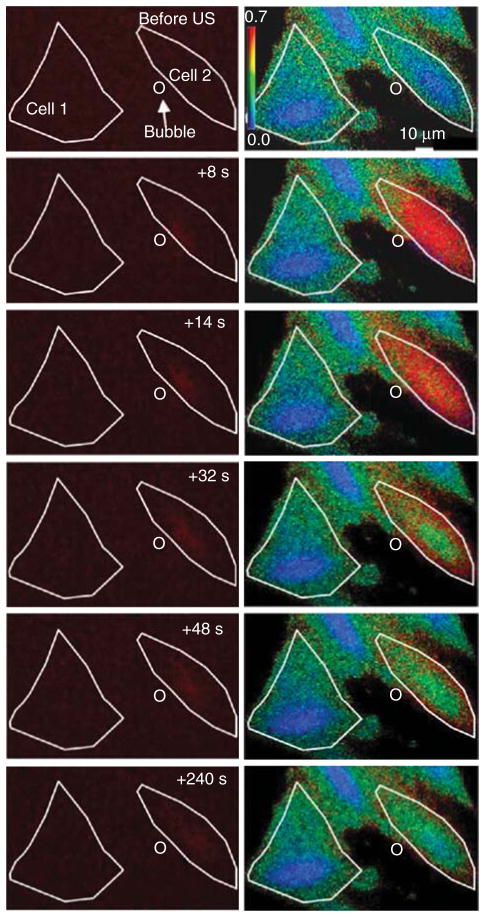
Figure 3. Propidium iodide (PI; left column) and intracellular [Ca2+]i flux (right column) during microbubble oscillation near a cell membrane.
Cell outlines, indicated by white lines, demarcate PI and Ca2+ delivery, when a bubble (circle) oscillates near its cell membrane. The initial state of the cell is seen in the first row, followed by subsequent images during ultrasound exposure.
Reprinted from Fan et al. [133], with permission from Elsevier (2012).

