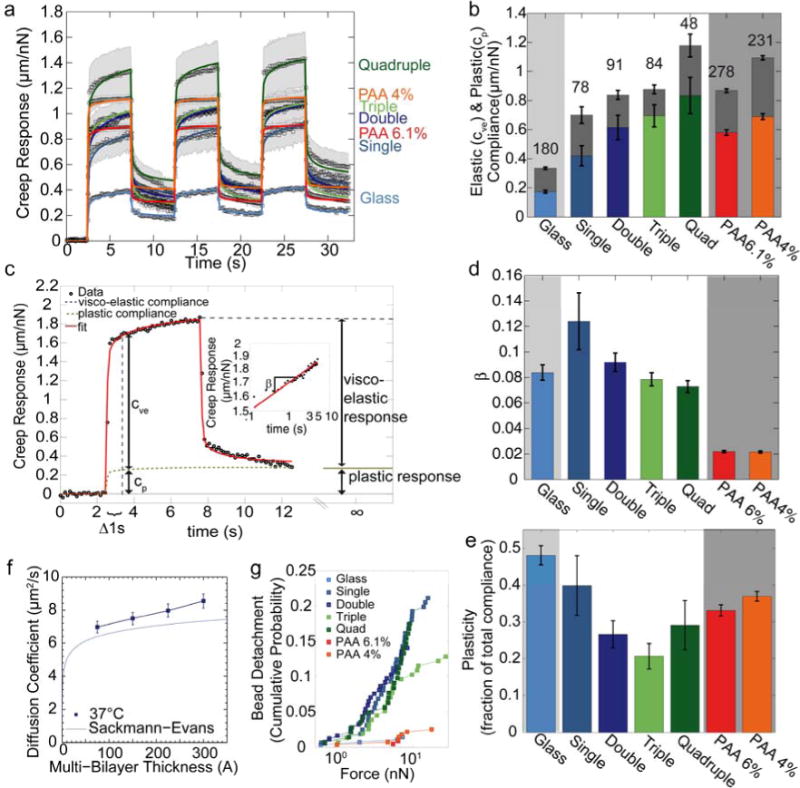
Figure 2. Viscoelastic substrate properties.

(a) Creep behavior (bead displacement normalized by lateral force) measured with superparamagentic beads bound to laminin on glass, polyacrylamide, or on stacked lipid bilayers. Data points are average values from n>48 individual measurements. The shaded area indicates one standard error of the mean. Solid lines are the fit of Eq. 4 to the data. (b) Elastic compliance cve (colored) and plastic compliance cp (gray) for different substrates. The lower error bars are standard errors of the elastic compliance, the upper error bars are the standard errors of the plastic compliance. The sum of elastic compliance and plastic compliance represents the total creep compliance (bead displacement at t0 = 1 s normalized to force). (c) Example of bead displacement on quadruple bilayer (black symbols) for a lateral force of 1 nN. The red line indicates the fit of Eq. 4 to the data. Elastic compliance cve and plastic compliance cp are determined at t0 = 1 s. (d) Power-law exponent β (a measure of substrate fluidity) for different substrates. (e) Plasticity as a fraction of total compliance. (f) Diffusion coefficient of Texas Red-labeled lipids of the top bilayer at 37°C m easured with FRAP (mean ± se from 15 independent measurements). The blue line indicates the theoretical expectations from the Sackmann-Evans-theory for supported bilayers [29, 30]. (g) Cumulative probability of bead detachment from the substrate as a function of pulling force on laminin-coated beads. Bead detachment probability is similar for all bilayer substrates, but is lower on glass and PAA.
