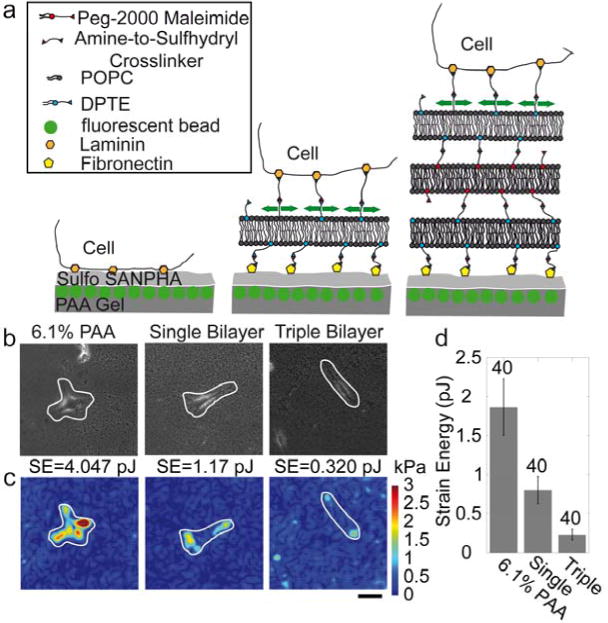
Figure 7. Cell tractions.

(a) Schematics of the method for measuring tractions of cells on stacked bilayers. (b) Bright field images of MEF cells cultured directly on a 6.1% PAA gel (left), on a single bilayer (middle) and a triple bilayer (right), both on top of a 6.1% PAA gel. (c) Corresponding traction maps (white lines indicate the cell outlines). Scale bar is 20 μm. (d) Elastic strain energy calculated with Eq. 3 from tractions and matrix displacements (mean ± se, n as indicated above bars) decreases with the number of stacked bilayers.
