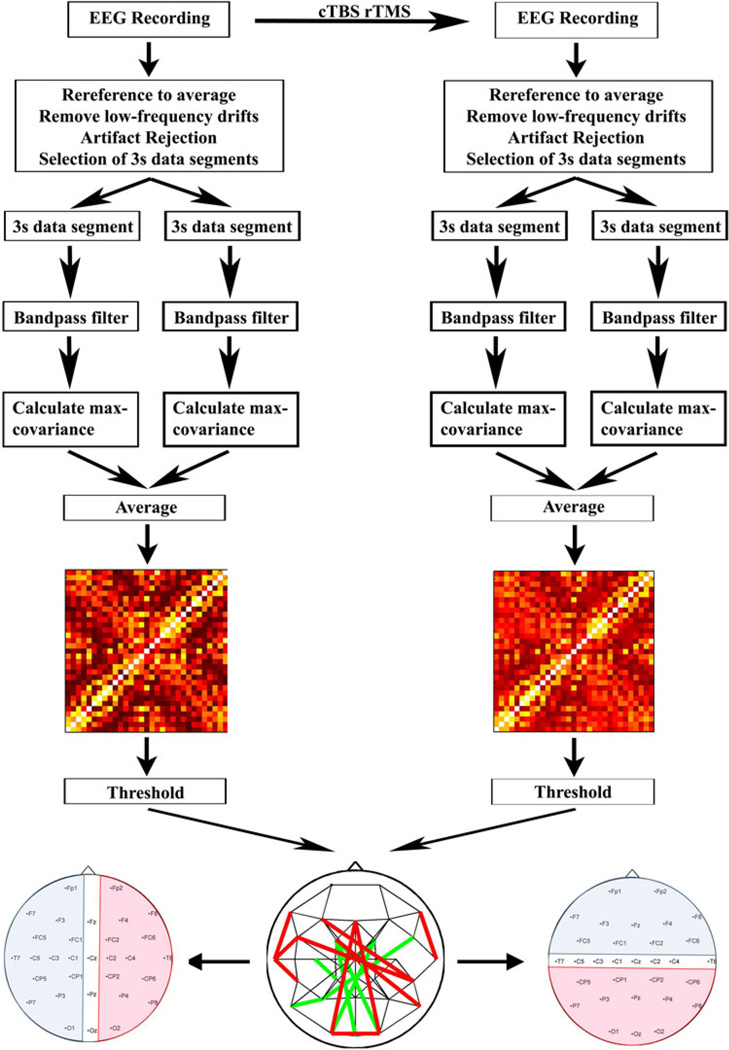
Fig. 1.
Experimental setup and data processing for each subject. EEG was recorded for up to 30 min with the subject in the eyes-closed, awake, resting state. This was followed by administration of 40 s of continuous theta burst repetitive TMS (cTBS). Afterwards, an additional 10 min of EEG data was recorded with the subject in the eyes-closed, awake, resting state. The EEG data was subsequently processed offline. The data was downsampled to 512 Hz, re-referenced to an average reference, and then detrended. Segments of data with artifact were subsequently removed, and multiple continuous 3-second segments of artifact-free data identified. Lagged max-covariance (MC) analysis was done on these 3-second segments, then average max-covariance values for each electrode pair were obtained by averaging across the values for individual 3 s segments. Subsequently a MC matrix was built. The MC matrices were thresholded to produce undirected graphs. Electrodes were grouped by hemisphere (left; blue = left, pink = right, clear = midline) or anterior–posterior axis (right; blue = anterior, pink = posterior, clear = midline)

