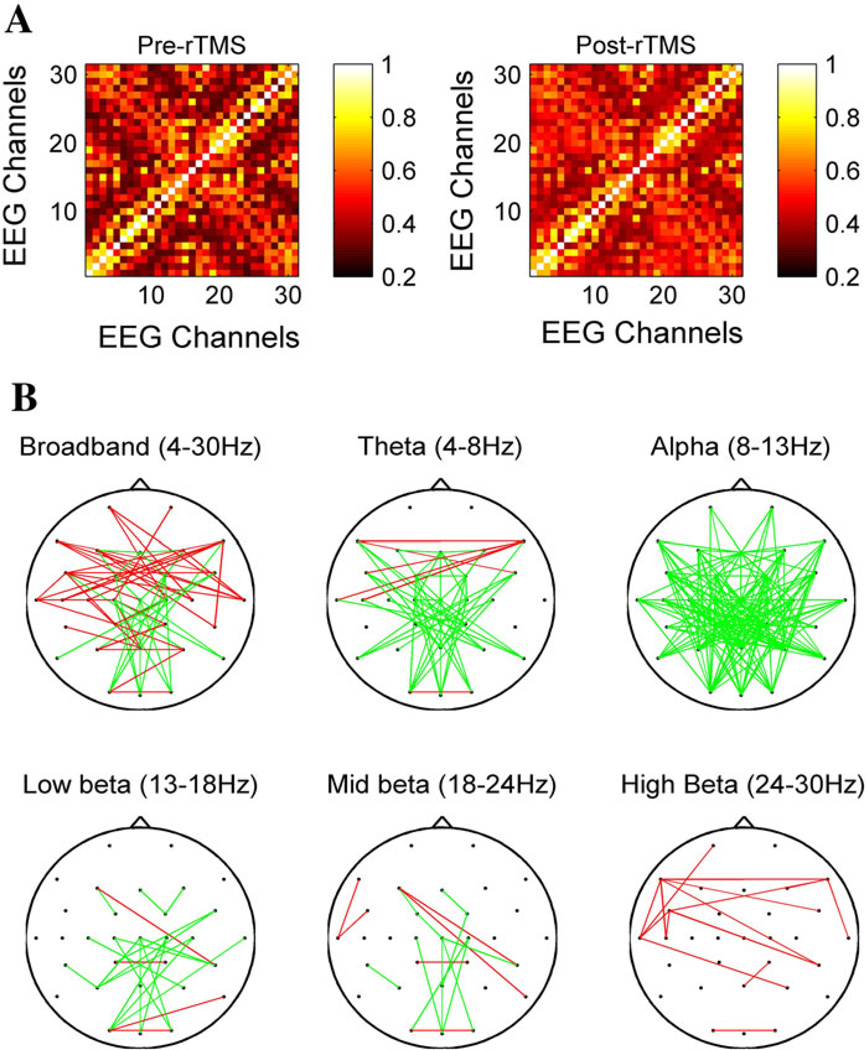
Fig. 3.
Max-correlation matrices and average functional connectivity changes. a shows the mean max-correlation matrices averaged across all subjects in the 4–30 Hz (broadband) frequency range before (left) and after (right) cTBS. The order of the electrodes is: Fp1, F7, F3, FC5, FC1, T7, C5, C3, C1, CP5, CP1, P7, P3, O1, Fz, Cz, Pz, Oz, Fp2, F8, F4, FC6, FC2, T8, C4, C2, CP6, CP2, P8, P4, O2. b shows the EEG channels with significant (unadjusted p < 0.0005) changes in functional connectivity after cTBS, across subjects, in each of the different frequency bands. Connections with increased connectivity are illustrated in red, connections with decreased connectivity are drawn in green

