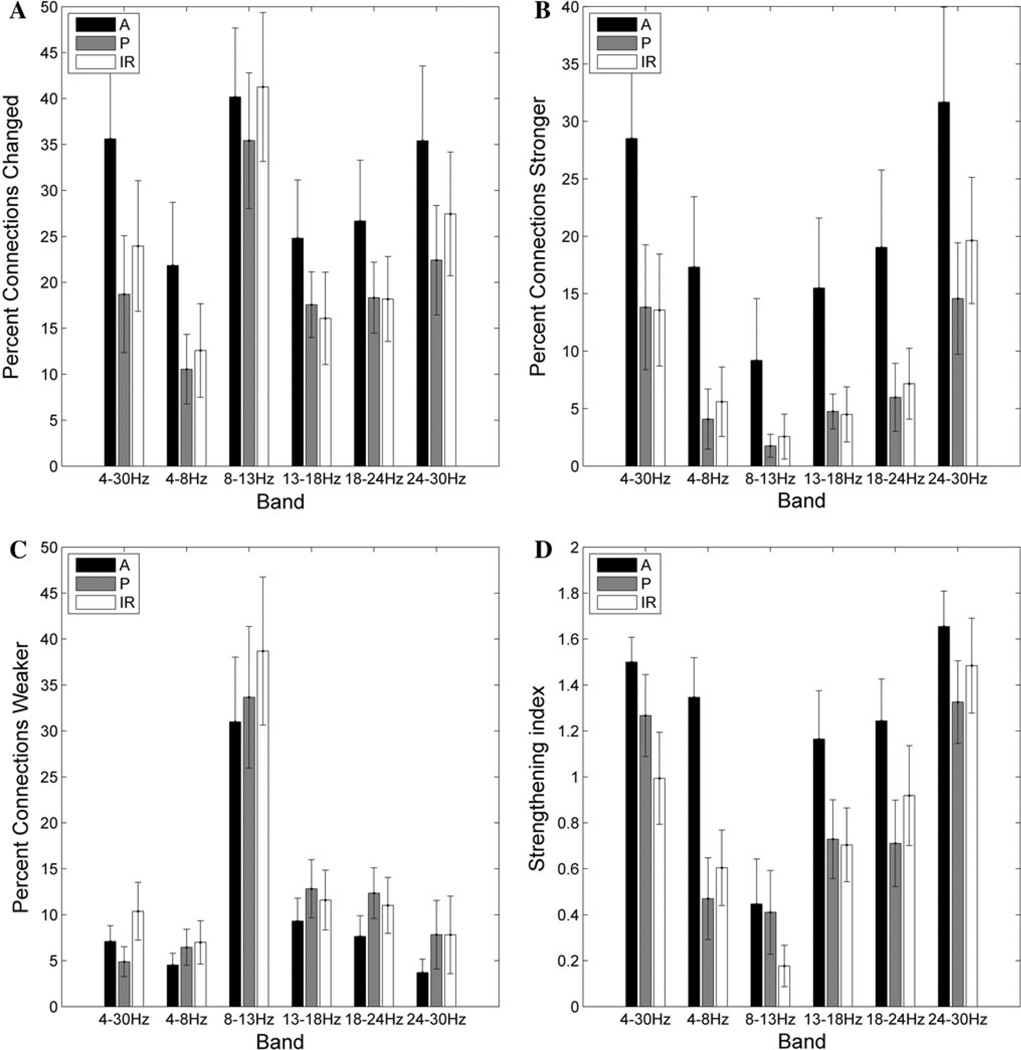
Fig. 4.
Frequency and region-specific changes in connection strength. a The average (across subjects) percentage of connections significantly changed after cTBS as a function of frequency band and region. b The average percentage of connections strengthened after cTBS. c The average percentage of connections weakened after cTBS. d The strengthening index (percentage of connections strengthened × 2/percentage of connections changed); A value greater than 1 indicates that more connections were strengthened than weakened, whereas a value less than 1 indicates that more connections were weakened. A = connection between two anterior electrodes, P = connection between two posterior electrodes, IR = interregional connection between an anterior and posterior electrode

